Report
Energy demand: Three drivers
Policy. Technology. Consumer preferences. All three impact how the world uses energy. Each driver influences the
other. The interplay between these can vary depending on local circumstances (available resources, public support) and
can change over time. At ExxonMobil, we’re continually studying energy demand and developing models that measure its
potential impact — all in an effort to gain a deeper understanding of the interconnectivity of the global energy system.
Report
In this article

Global energy demand by sector
Primary energy – Quadrillion Btu
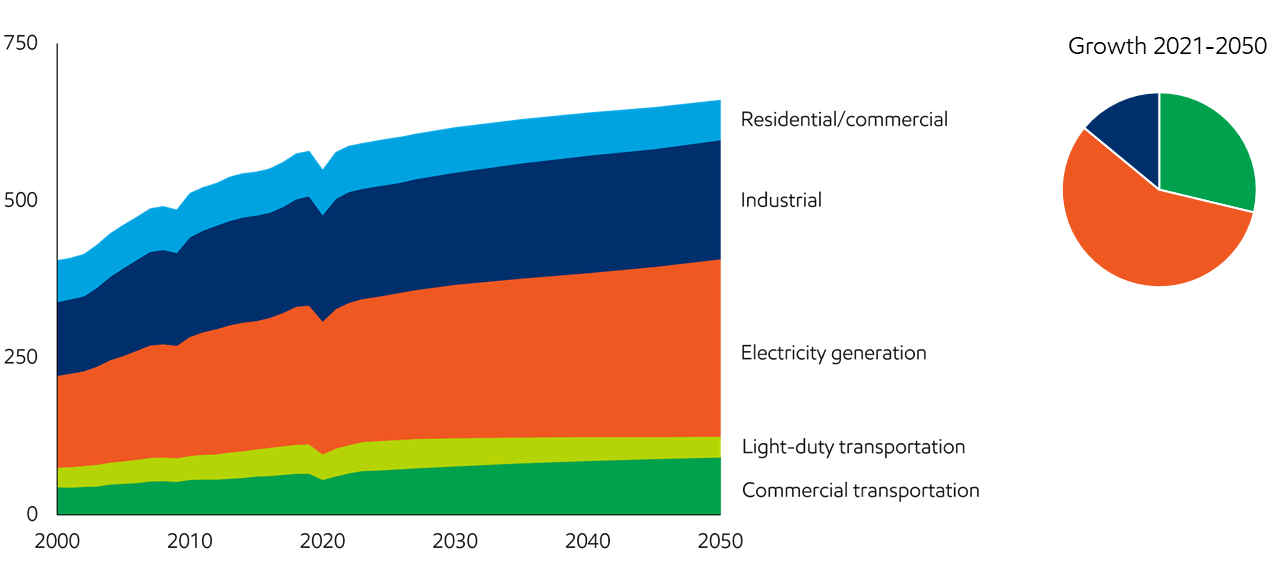
- Global demand reaches about 660 quadrillion Btu in 2050, up about 15% versus 2021, reflecting a growing population and rising prosperity.
- Residential and commercial primary energy demand declines by approximately 15% to 2050 as efficiency improvements offset the energy needs of a growing population.
- Electricity generation is the largest sector and one of the fastest-growing, driven mainly by expanding access to reliable electricity in developing countries. Growing electrification is partially offset by efficiency gains in the developed countries.
- Industrial sector growth supports construction of buildings and infrastructure, plus the manufacturing of products that meet people’s needs.
- Commercial transportation grows as expanding economies increase the need to move goods. Personal mobility also expands, but efficiency improvements and more electric vehicles offset the increase in vehicle miles traveled.
- Global energy consumption continues to shift proportionally to developing economies where population and economic growth are both faster than the global average. Non-OECD share of global energy demand reaches around 70% in 2050.
- Developing countries account for more than 100% of the global energy demand growth.
- Efficiency gains outpace economic growth in developed countries, which helps offset energy demand increases historically linked to economic expansion.
- The combined share of energy used in the U.S. and Europe declines from about 30% in 2021 to about 20% in 2050.
Developing countries lead energy demand
Primary energy – Quadrillion Btu

- Global energy consumption continues to shift proportionally to developing economies where population and economic growth are both faster than the global average. Non-OECD share of global energy demand reaches ~70 percent in 2040
- China and India contribute ~50 percent of the world’s energy demand growth to 2040
- Efficiency gains outpace economic growth in the OECD, which helps offset energy demand increases historically linked to economic expansion
- The combined share of energy used in the United States and European OECD nations declines from about 30 percent in 2017 to less than 25 percent in 2040
Global energy mix shifts to lower-carbon fuels
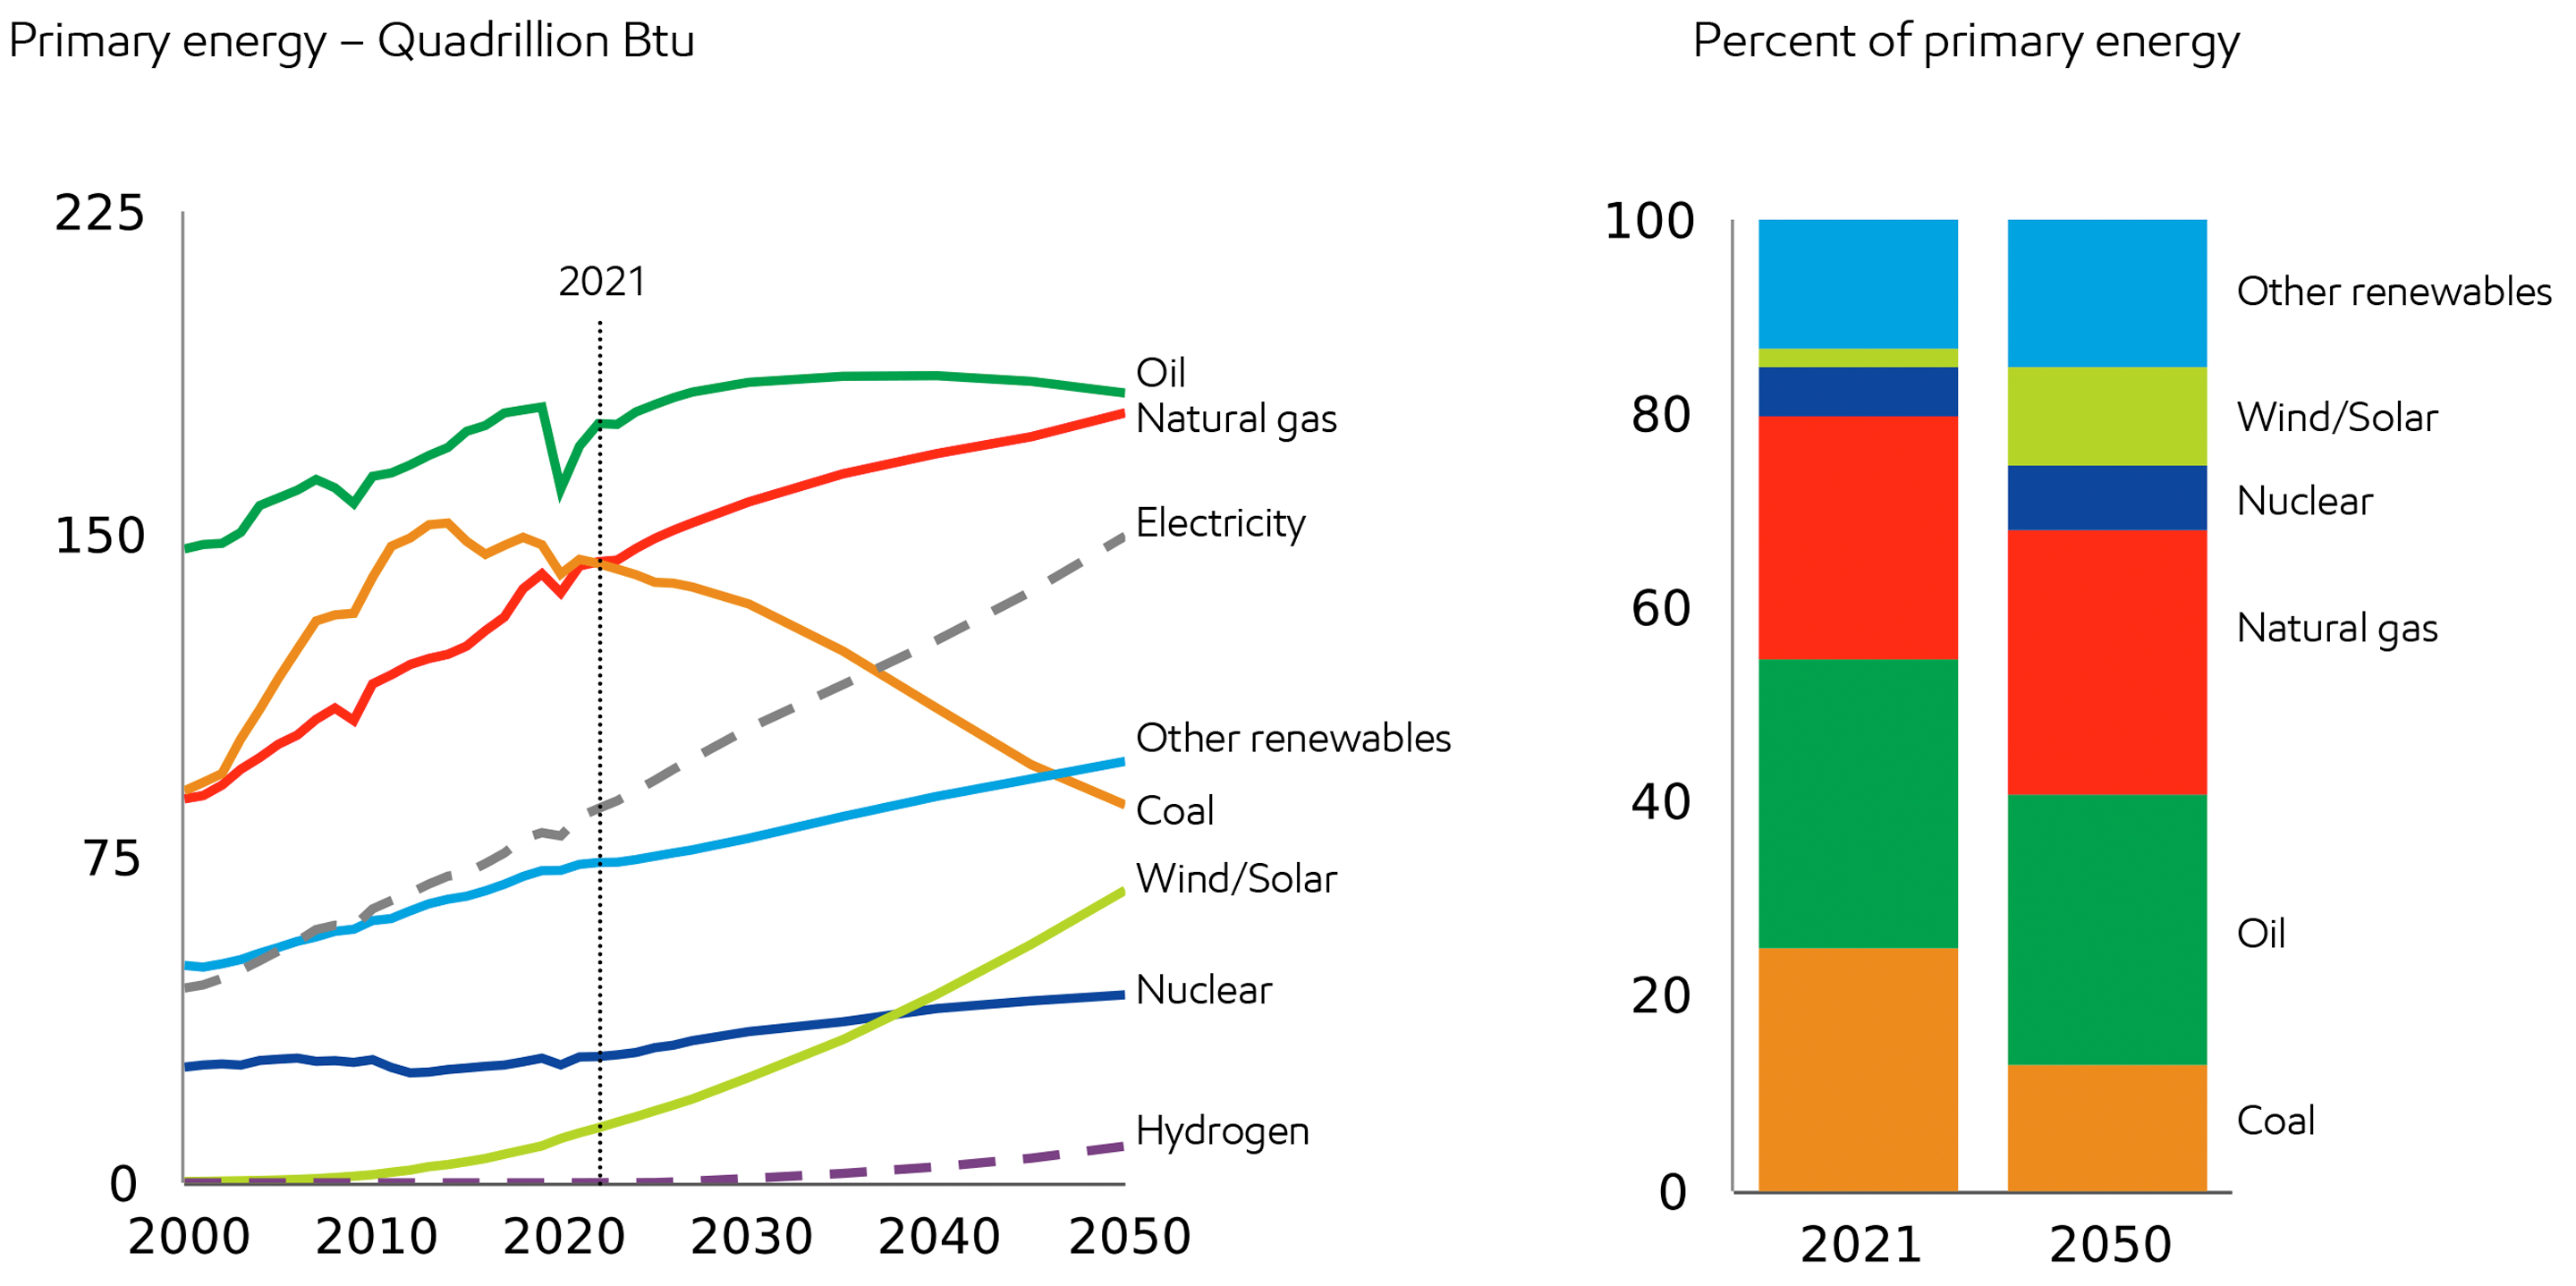
- Renewables and nuclear see strong growth, contributing around 70% of incremental energy supplies to meet demand growth.
- Natural gas grows over the period, reaching almost 30% of all demand.
- Oil continues to play a leading role, with growing demand driven by commercial transportation and feedstocks for the chemicals industry.
- Coal use remains significant in parts of the developing world. It drops below 15% global share as China and developed nations shift toward lower-emission sources like renewables, nuclear and natural gas.
- Electricity, an energy carrier and not an energy source, grows approximately four times faster than overall energy demand.
Visit energyfactor.com to learn more about technology and innovations such as our cogeneration operations generating electricity and heat that are helping make operations more energy efficient.
Transportation
Commerce and trade increase transportation energy consumption by almost 25% by 2050. The movement of people and goods has grown dramatically over the past few decades, driven by vast growth in the purchasing power of individuals. Likewise, technology advancements have provided new and more efficient ways to get around.
Global transportation demand is driven by differing trends for commercial transportation and light-duty passenger vehicles. As economic activity expands, especially in developing regions, commercial transportation is expected to grow. Most of the growth comes from heavy-duty trucking as a result of goods movement. Increased aviation travel also plays a role as individual purchasing power expands.
Passenger vehicle ownership and travel is expected to increase as a result of the dramatic growth in the middle class and expanded urbanization. The fuel mix continues to evolve with more alternatives including electric vehicles (BEV and PHEV).
Hypothetical sensitivities for light-duty demand showed that if by 2035, every new car sale was an electric vehicle, liquids demand would still remain around 2010 levels by 2050. Alternatively, a slowdown in fuel efficiency improvement of internal combustion engines could increase fuel demand by almost 3 million barrels per day by 2050
.
Global transportation energy demand
Million of oil-equivalent barrels per day

- Global transportation-related energy demand is expected to grow by more than 30% from 2021 to 2050.
- Personal vehicle ownership continues to grow as purchasing power rises. Higher efficiency and more electric vehicles lead to a peak, followed by a decline in light-duty vehicle energy demand in the mid-2020s.
- Commercial transportation (heavy-duty trucking, aviation, marine and rail) energy demand is led by growth in economic activity and personal buying power, which drives increasing trade of goods and services.
- Aviation demand sees the highest compounded annual growth rate at about 3.5% from 2021 to 2050, benefiting from rising economic activity and the rapid growth of the middle class, specifically in emerging economies.
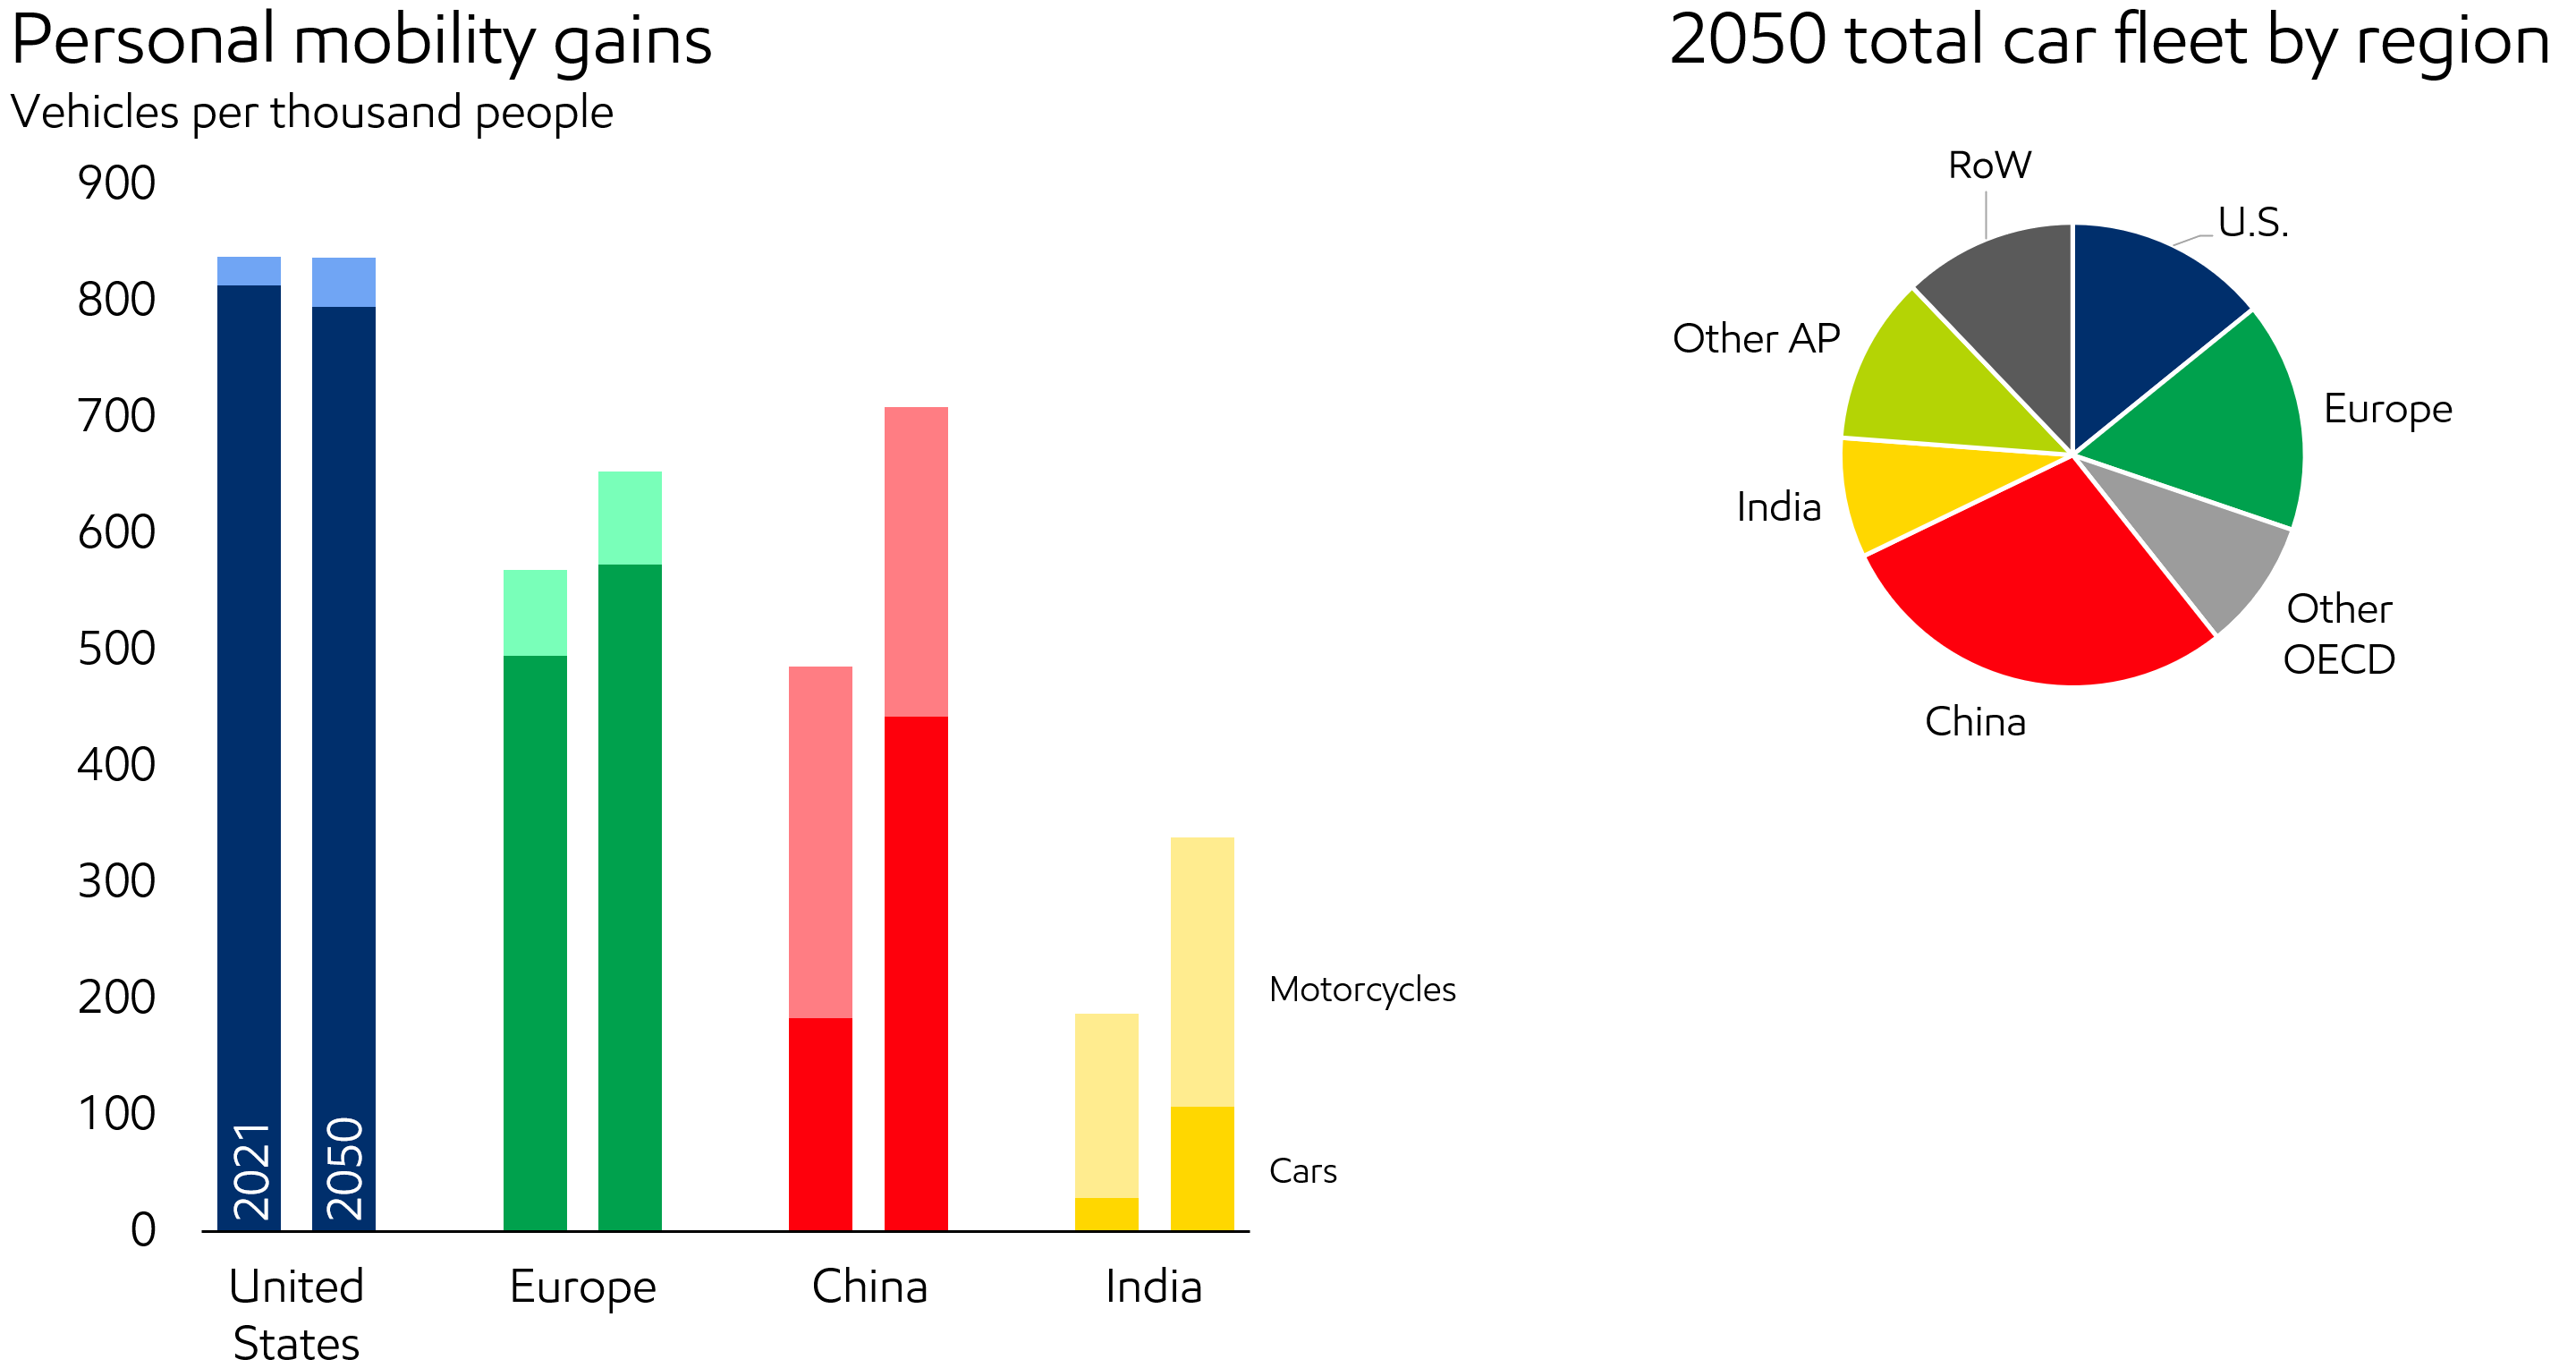
- When individual purchasing power increases, access to personal mobility also increases, driving growth of the global fleet of light-duty vehicles and motorcycles
- Motorcycles offer a lower-cost entry point to personal mobility, with ownership and growth particularly high in Asia Pacific
- Increasing access to vehicles drives a worldwide increase in personal mobility-related energy demand growth, with Asia Pacific leading the growth
- In the OECD (such as U.S. and Europe), while the number of cars per 1,000 people increases by about 10 percent, passenger vehicle fuel demand declines about 30 percent on average as a result of efficiency gains and powertrain diversification
Light-duty fleet by type
EVs take market share – Billion fleet vehicles

Light-duty demand drops
Million of oil-equivalent barrels per day

Personal mobility rises with incomes, resulting in a growing demand for cars and motorcycles.
- Motorcycles offer a lower-cost entry point to personal mobility, with ownership particularly high in Asia Pacific.
- China and India lead the growth of car ownership, with larger growth in developing countries.
- In developed nations, while the number of cars per 1,000 people increases, the associated vehicle fuel demand declines by around 40% by 2050.
- In 2021, the global fleet was about 1.2 billion vehicles, with 16 million (1.3%) of the fleet being plug-in hybrids, battery electric, or fuel cell.
- By 2050, these advanced vehicles grow to approximately 44% of the fleet (920 million) and more than 50% of new car sales, driven by decreasing battery costs, policies for tailpipe emissions, efficiency and reduced dependence for countries that must import oil. In the near term EV sales grow from 6.4 million in 2021 to 33 million in 2030 at a compounded annual growth rate of about 20%.
- Light-duty vehicle demand for internal combustion engine (ICE) fuels is projected to peak mid decade and then decline to levels seen in the early-2000s by 2050.
- The reduction in fuel demand, while driven in part by electrification, is mostly connected with efficiency gains across all vehicle types.
Global transportation energy demand relative to GDP
Index, 1990=100

- Historically, commercial transportation services (e.g. ton-miles of freight,passenger-miles of air travel) demand growth tracks with GDP and economic growth
- As GDP continues to grow, especially in developing nations, there will be increased demand for goods and services
- Recent accelerated decoupling of the trends for GDP and commercial transportation demand has been observed and is expected to continue as a result of fuel switching and efficiency improvements (e.g., mode shifting, engine improvements or logistical improvements)
- Continued improvements in efficiency will moderate commercial transportation energy demand associated with expanding economic activity.
All modes of commercial transportation grow
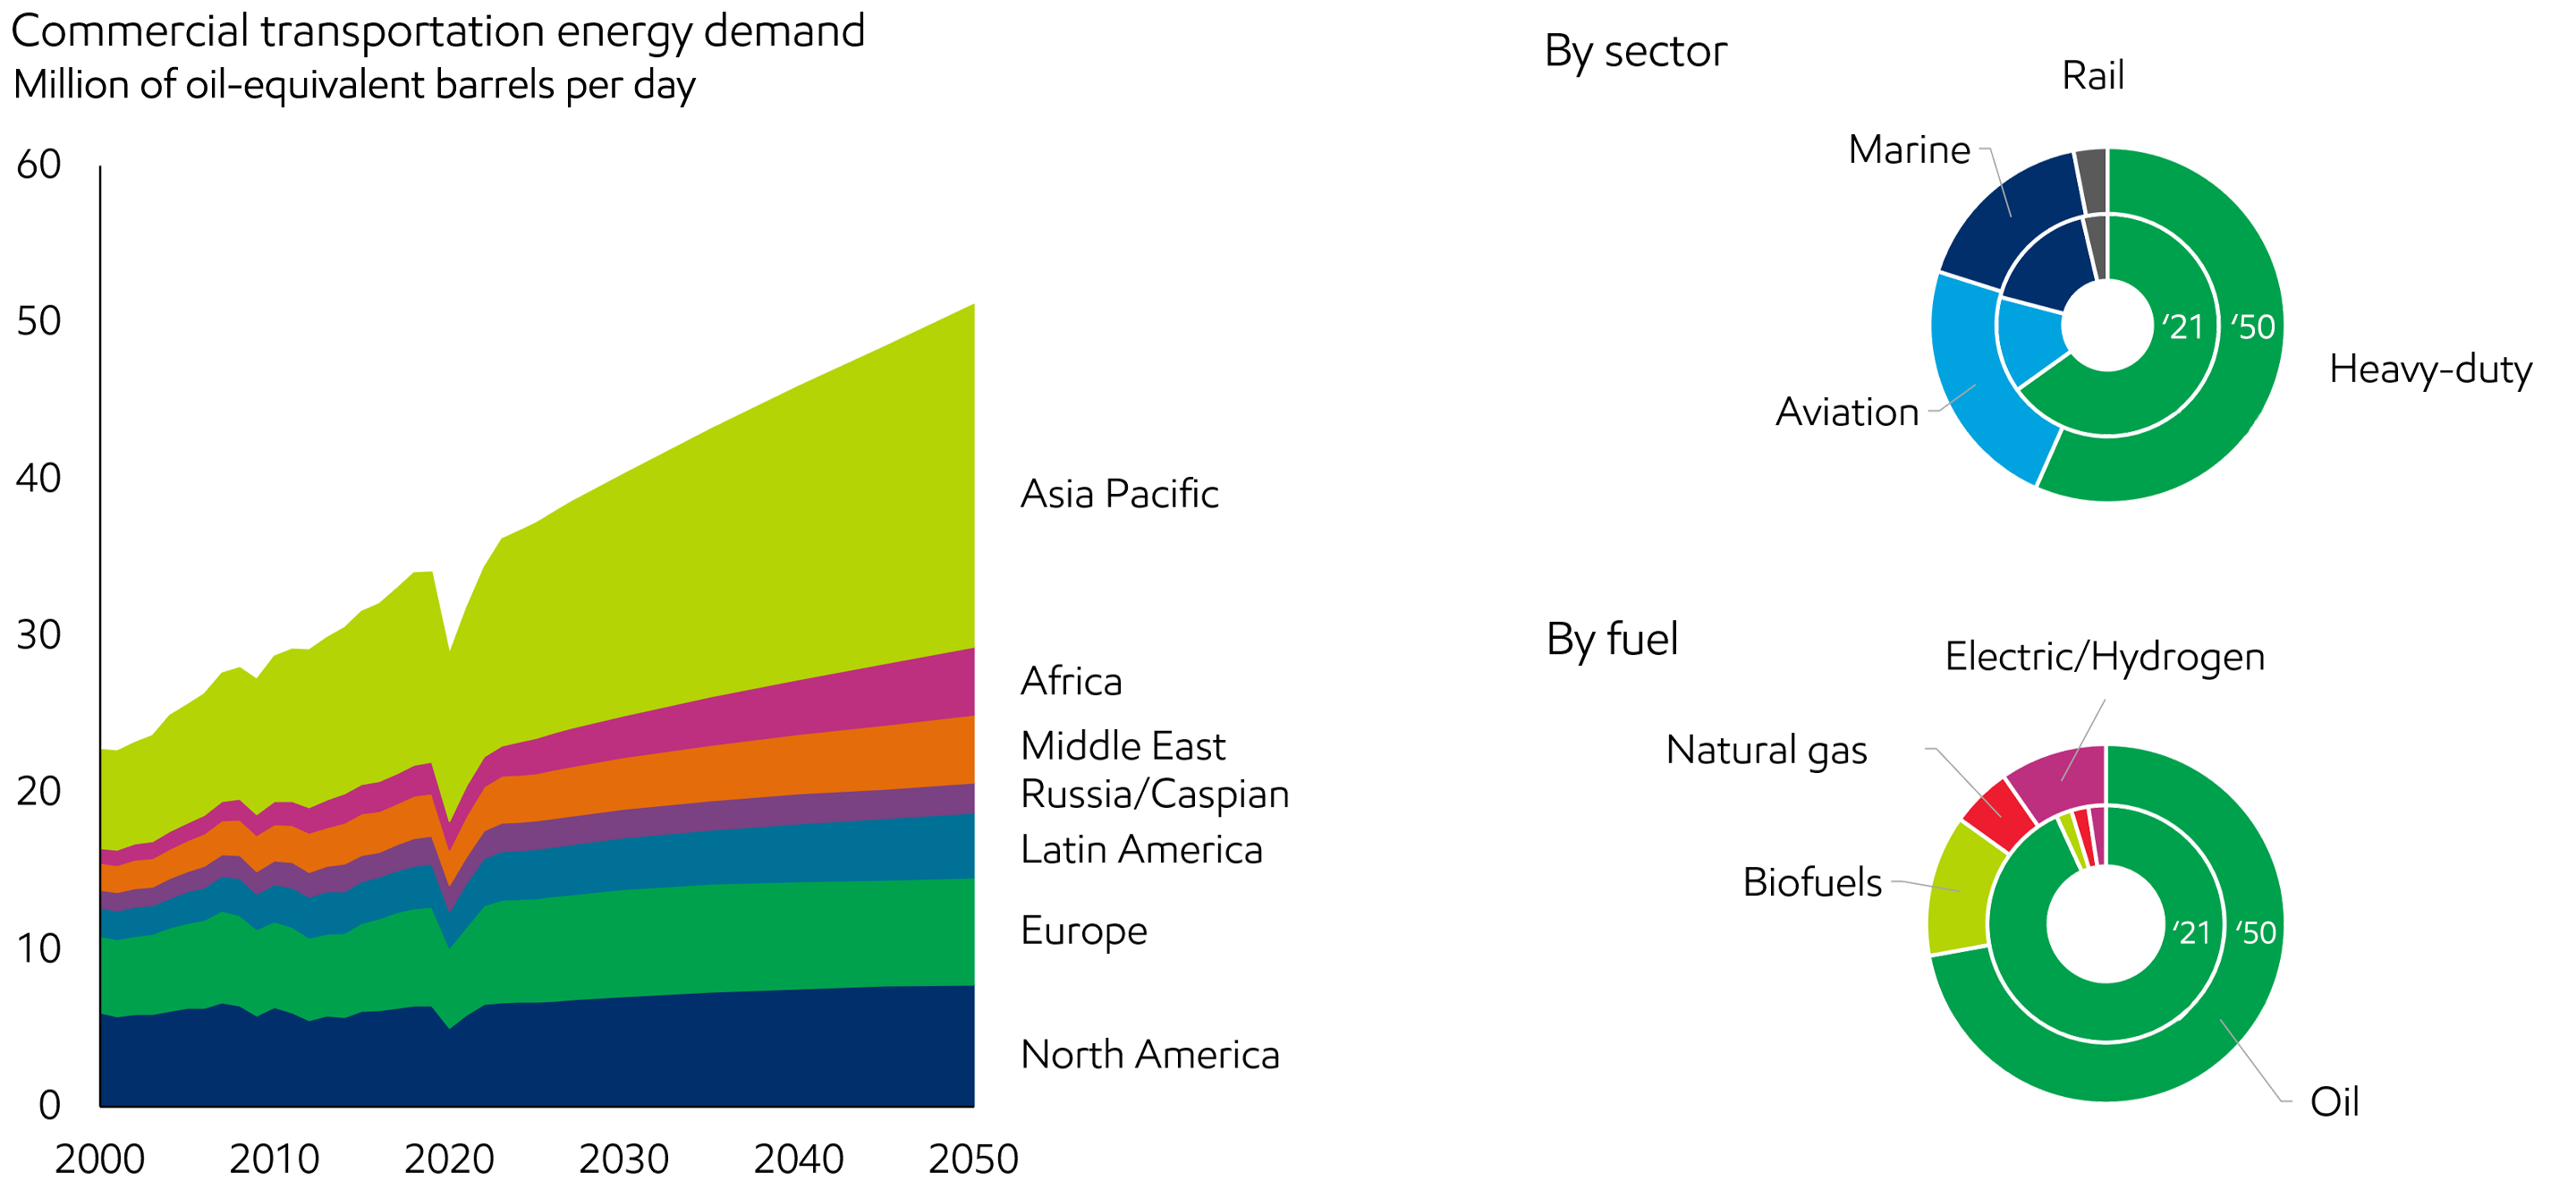
- Commercial transportation rises in all regions, with 80% of the growth in developing countries, driven by increases in population and GDP.
- While all regions see some increased demand, Asia Pacific leads the growth, accounting for more than 40% of commercial transportation energy demand by 2050.
- Continued improvements in efficiency will moderate the sector’s energy demand, which is historically associated with expanding economic activity.
- All modes of commercial transportation grow from 2021 to 2050, with heavy-duty transportation growing the most and air transportation growing the fastest.
- Electrification plays a role in certain applications, like short-haul trucks and buses. It is less suitable in heavy long-haul, international marine, or aviation, which require higher energy storage to meet range requirements.
- Hydrogen is expected to make inroads into commercial transportation as technology improves to lower costs and policy develops to support the needed infrastructure development.
- Natural gas (LNG on ships) and biofuels (sustainable aviation fuels) are expected to take a larger share than electricity for these sectors.
Heavy-duty landscape
Heavy-duty transportation demand is driven by economic activity, which leads to increased commerce and movement of goods across oceans, nations, and cities. Fuel demand in this sector is influenced by the type of truck and its use, so understanding fleet dynamics and fuel usage is important for projecting future demand. For example, a light commercial vehicle (LCV) for intra-city deliveries has different energy needs than a heavy commercial vehicle (HCV) for cross-country shipments of goods. Truck fleets also vary by region.
2015 Heavy-duty fleet/fuel usage mix
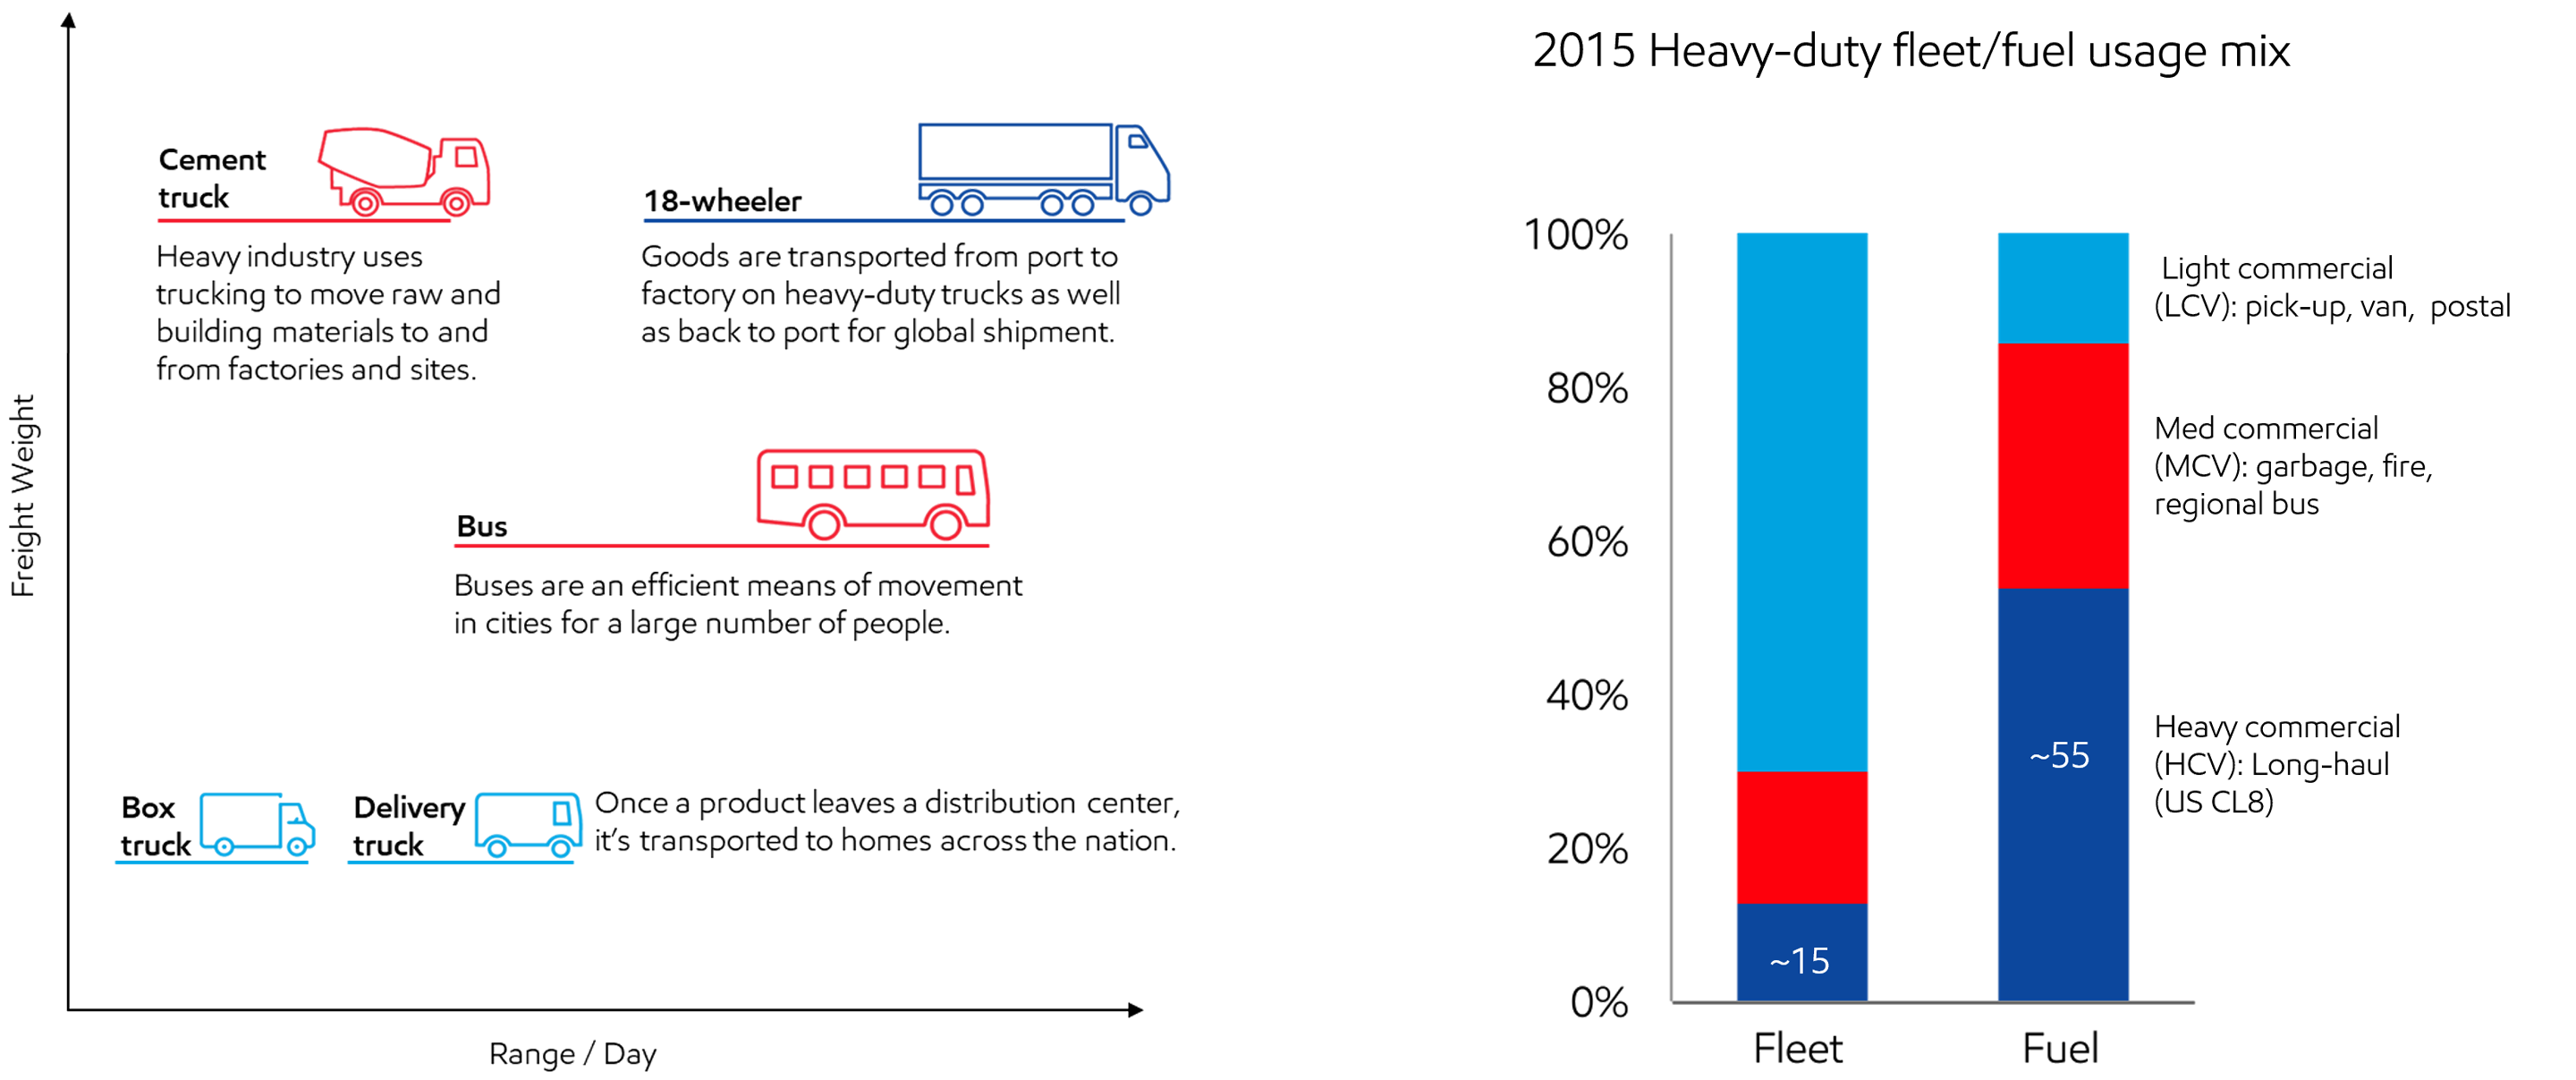
Source: IEA The Future of Trucks 2017, ExxonMobil analysis (2019)
- Fleet breakdown and truck usage play a critical role in understanding the types of alternate fuels available for substitution in trucking.
- In 2015, HCV long-haul trucks made up about 15% of the fleet and used approximately 55% of the fuel for trucking driven by the heavy loads carried over long distances.
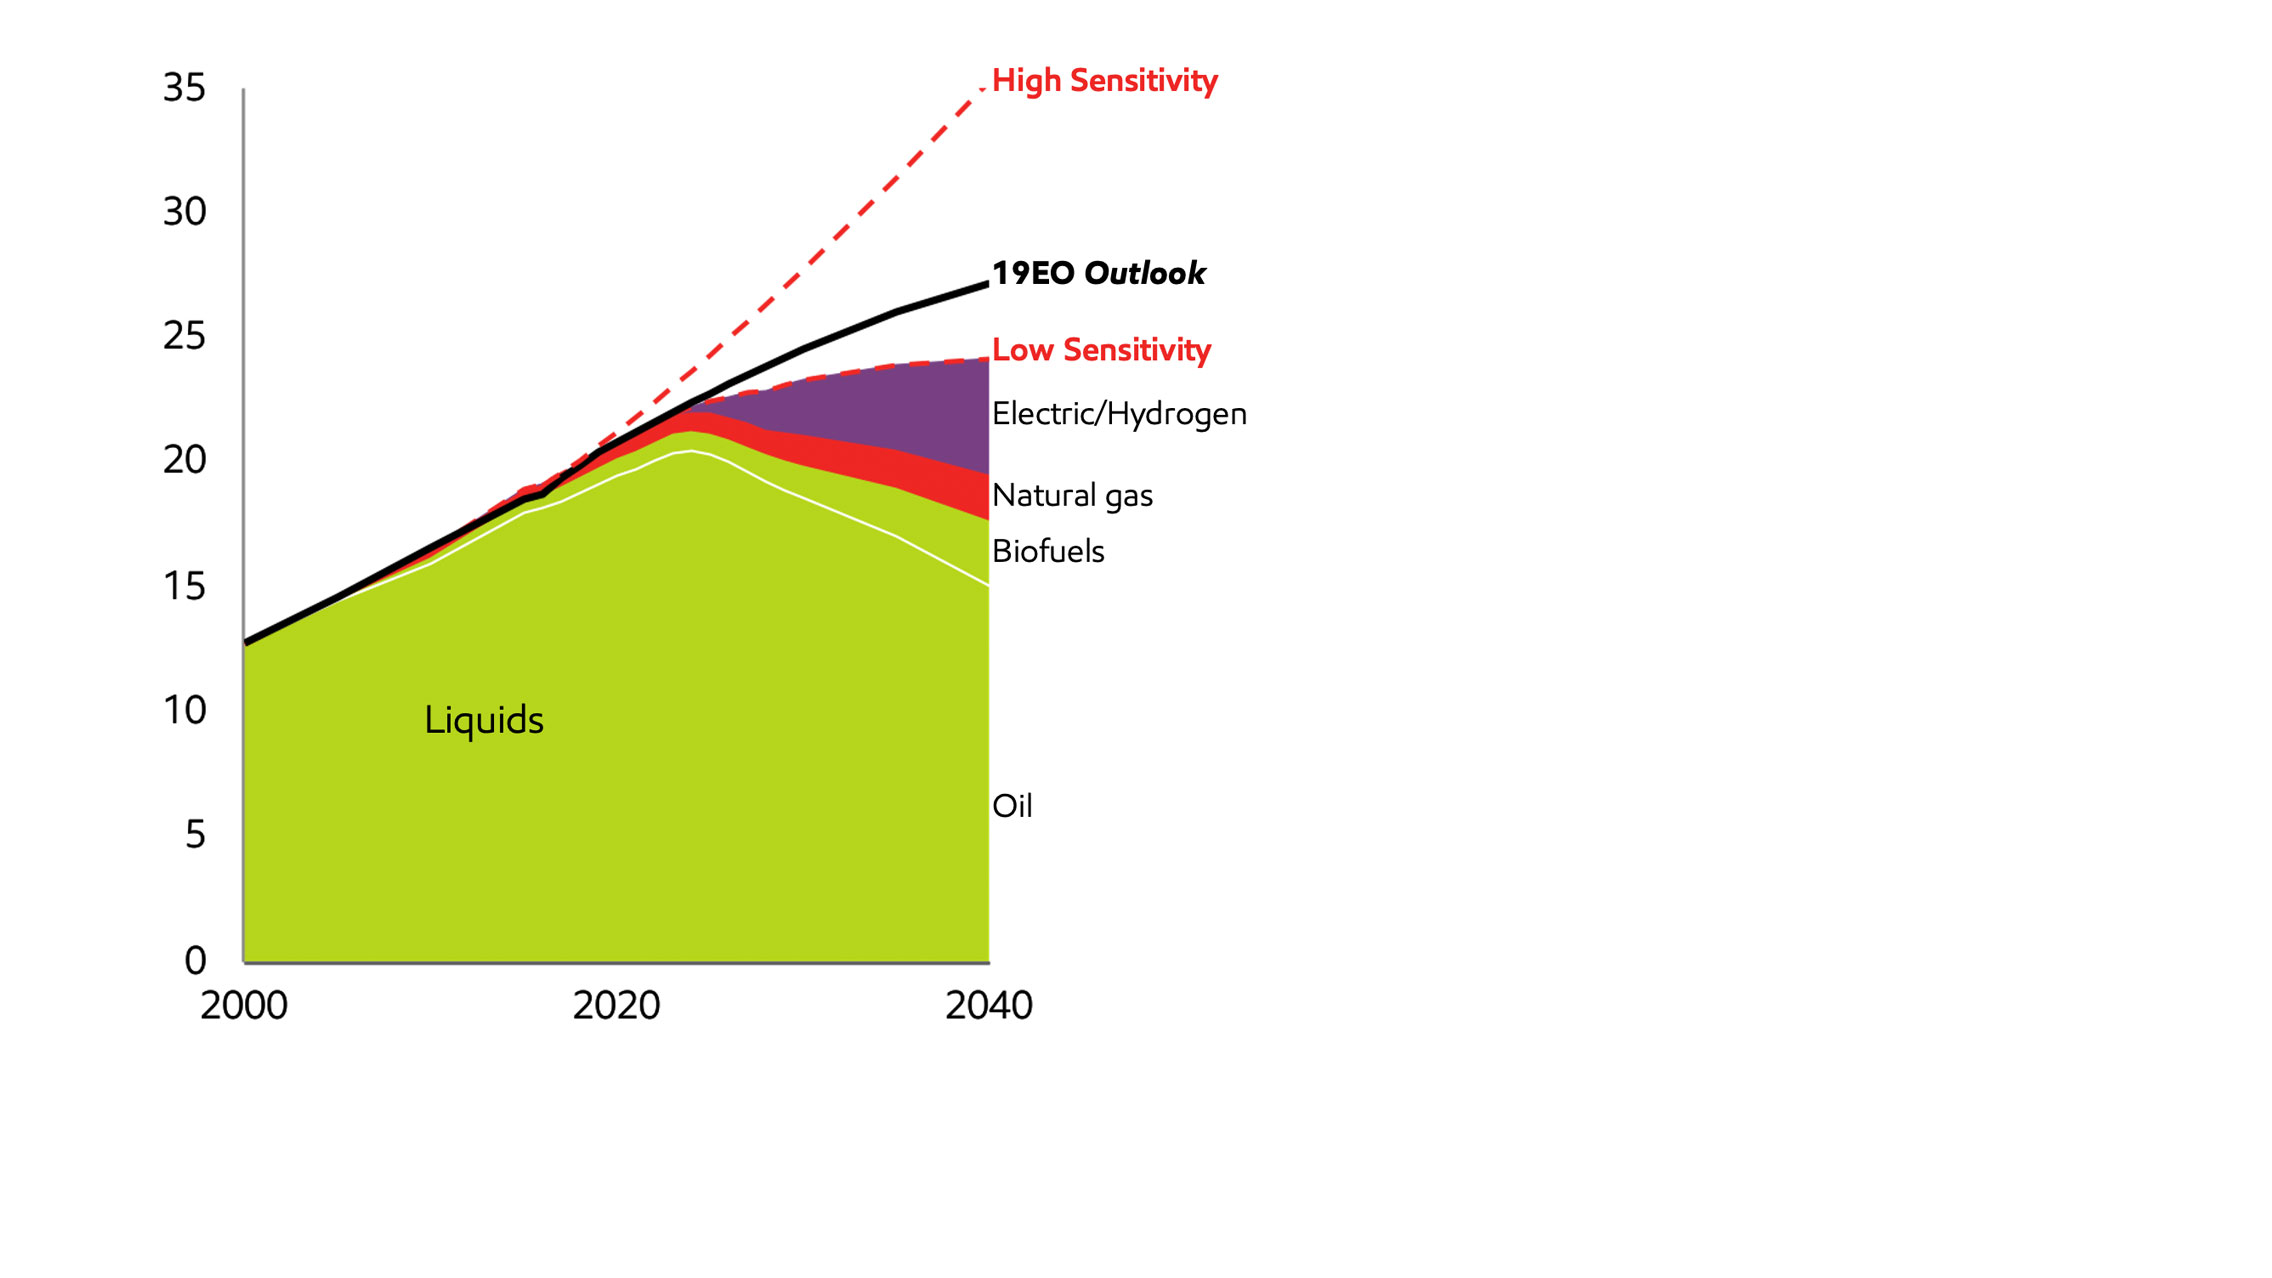
Heavy-duty fuels demand sensitivities
World – MBDOE
Liquids demand sensitivities by sector
World – MBDOE
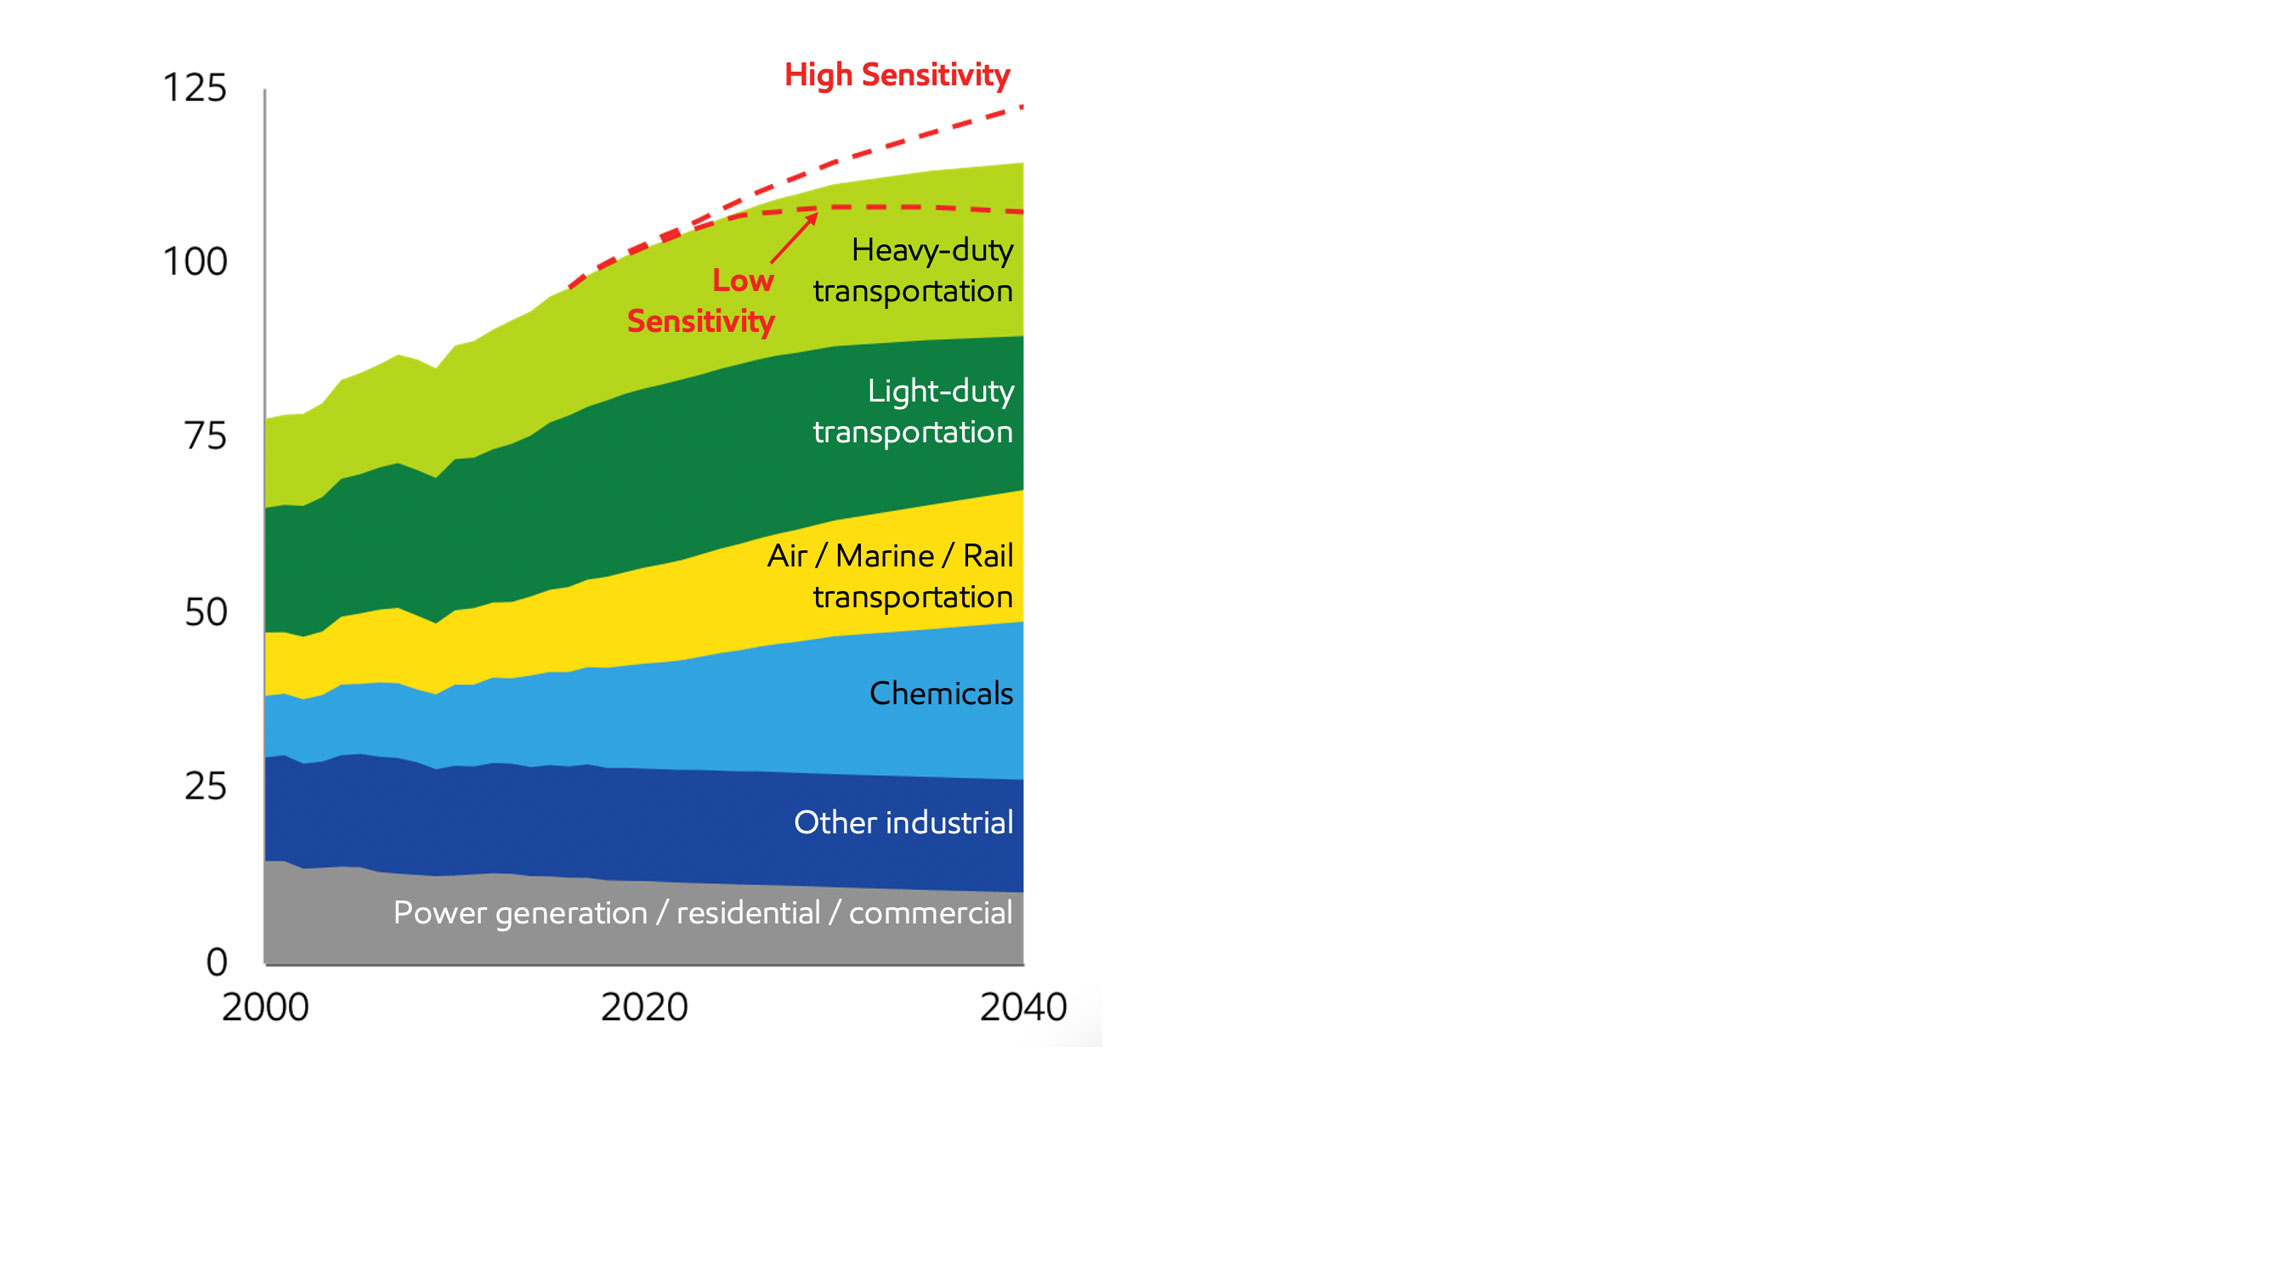
Source: 2019 Energy Outlook
- The 2019 Outlook assumes that future efficiency improves on average at double the historical rate from 2000 - 2016, and that alternative fuels grow to ~13% of demand
- In comparison, the high demand sensitivity above assumes future efficiency improves only at the historical rate, which could increase demand ~30% versus the 2019 Outlook, and highlights the need for continued technology investments in efficiency improvements.
- The low demand sensitivity assumes a deeper penetration of alternative fuels with accompanying efficiency gains. The penetration assumptions vary by truck type and usages. LCVs see nearly 100% penetration of Electric Vehicles due to shorter, start/stop routes, MCVs see 70% alternative fuels, and HCVs see ~20% alternatives, mostly biofuels due to the need for high energy density fuels in long-haul trucks. This sensitivity would require a rapid acceleration in the early 2020s of both alternate fuels into the heavy-duty fleet as well as infrastructure build-out to support the alternatives. The resulting fuel penetration is approximately three times the 2019 Outlook in 2040, with traditional fuel demand peaking prior to 2025 before declining to mid-2000s levels.
- The impact on total liquids demand from the high sensitivity shows liquids demand could be ~7% above the 2019 Outlook, while in the low demand sensitivity total liquids demand could peak in the mid-2030s as growth in chemicals, aviation and marine are offset by the heavy-duty decline.
- These hypothetical sensitivities highlight the difficulty of decarbonizing heavy-duty transportation and the need for further technology development on economic, lower-emission solutions.
Demand shifts to developing countries with growth primarily supplied by electricity

- Rising prosperity and expanding commercial activity leads to an increase of about 15% in energy demand.
- Strong middle-class growth in developing nations increases energy demand by about 35%. Improving building efficiencies reduce energy demand in developed countries by about 15% by 2050.
- Globally, electricity demand rises by 1.8% per year, growing to almost 50% of this sector by 2050, as traditional biomass, coal and oil demand decline
Household electricity up in non-OECD
Residential electricity intensity
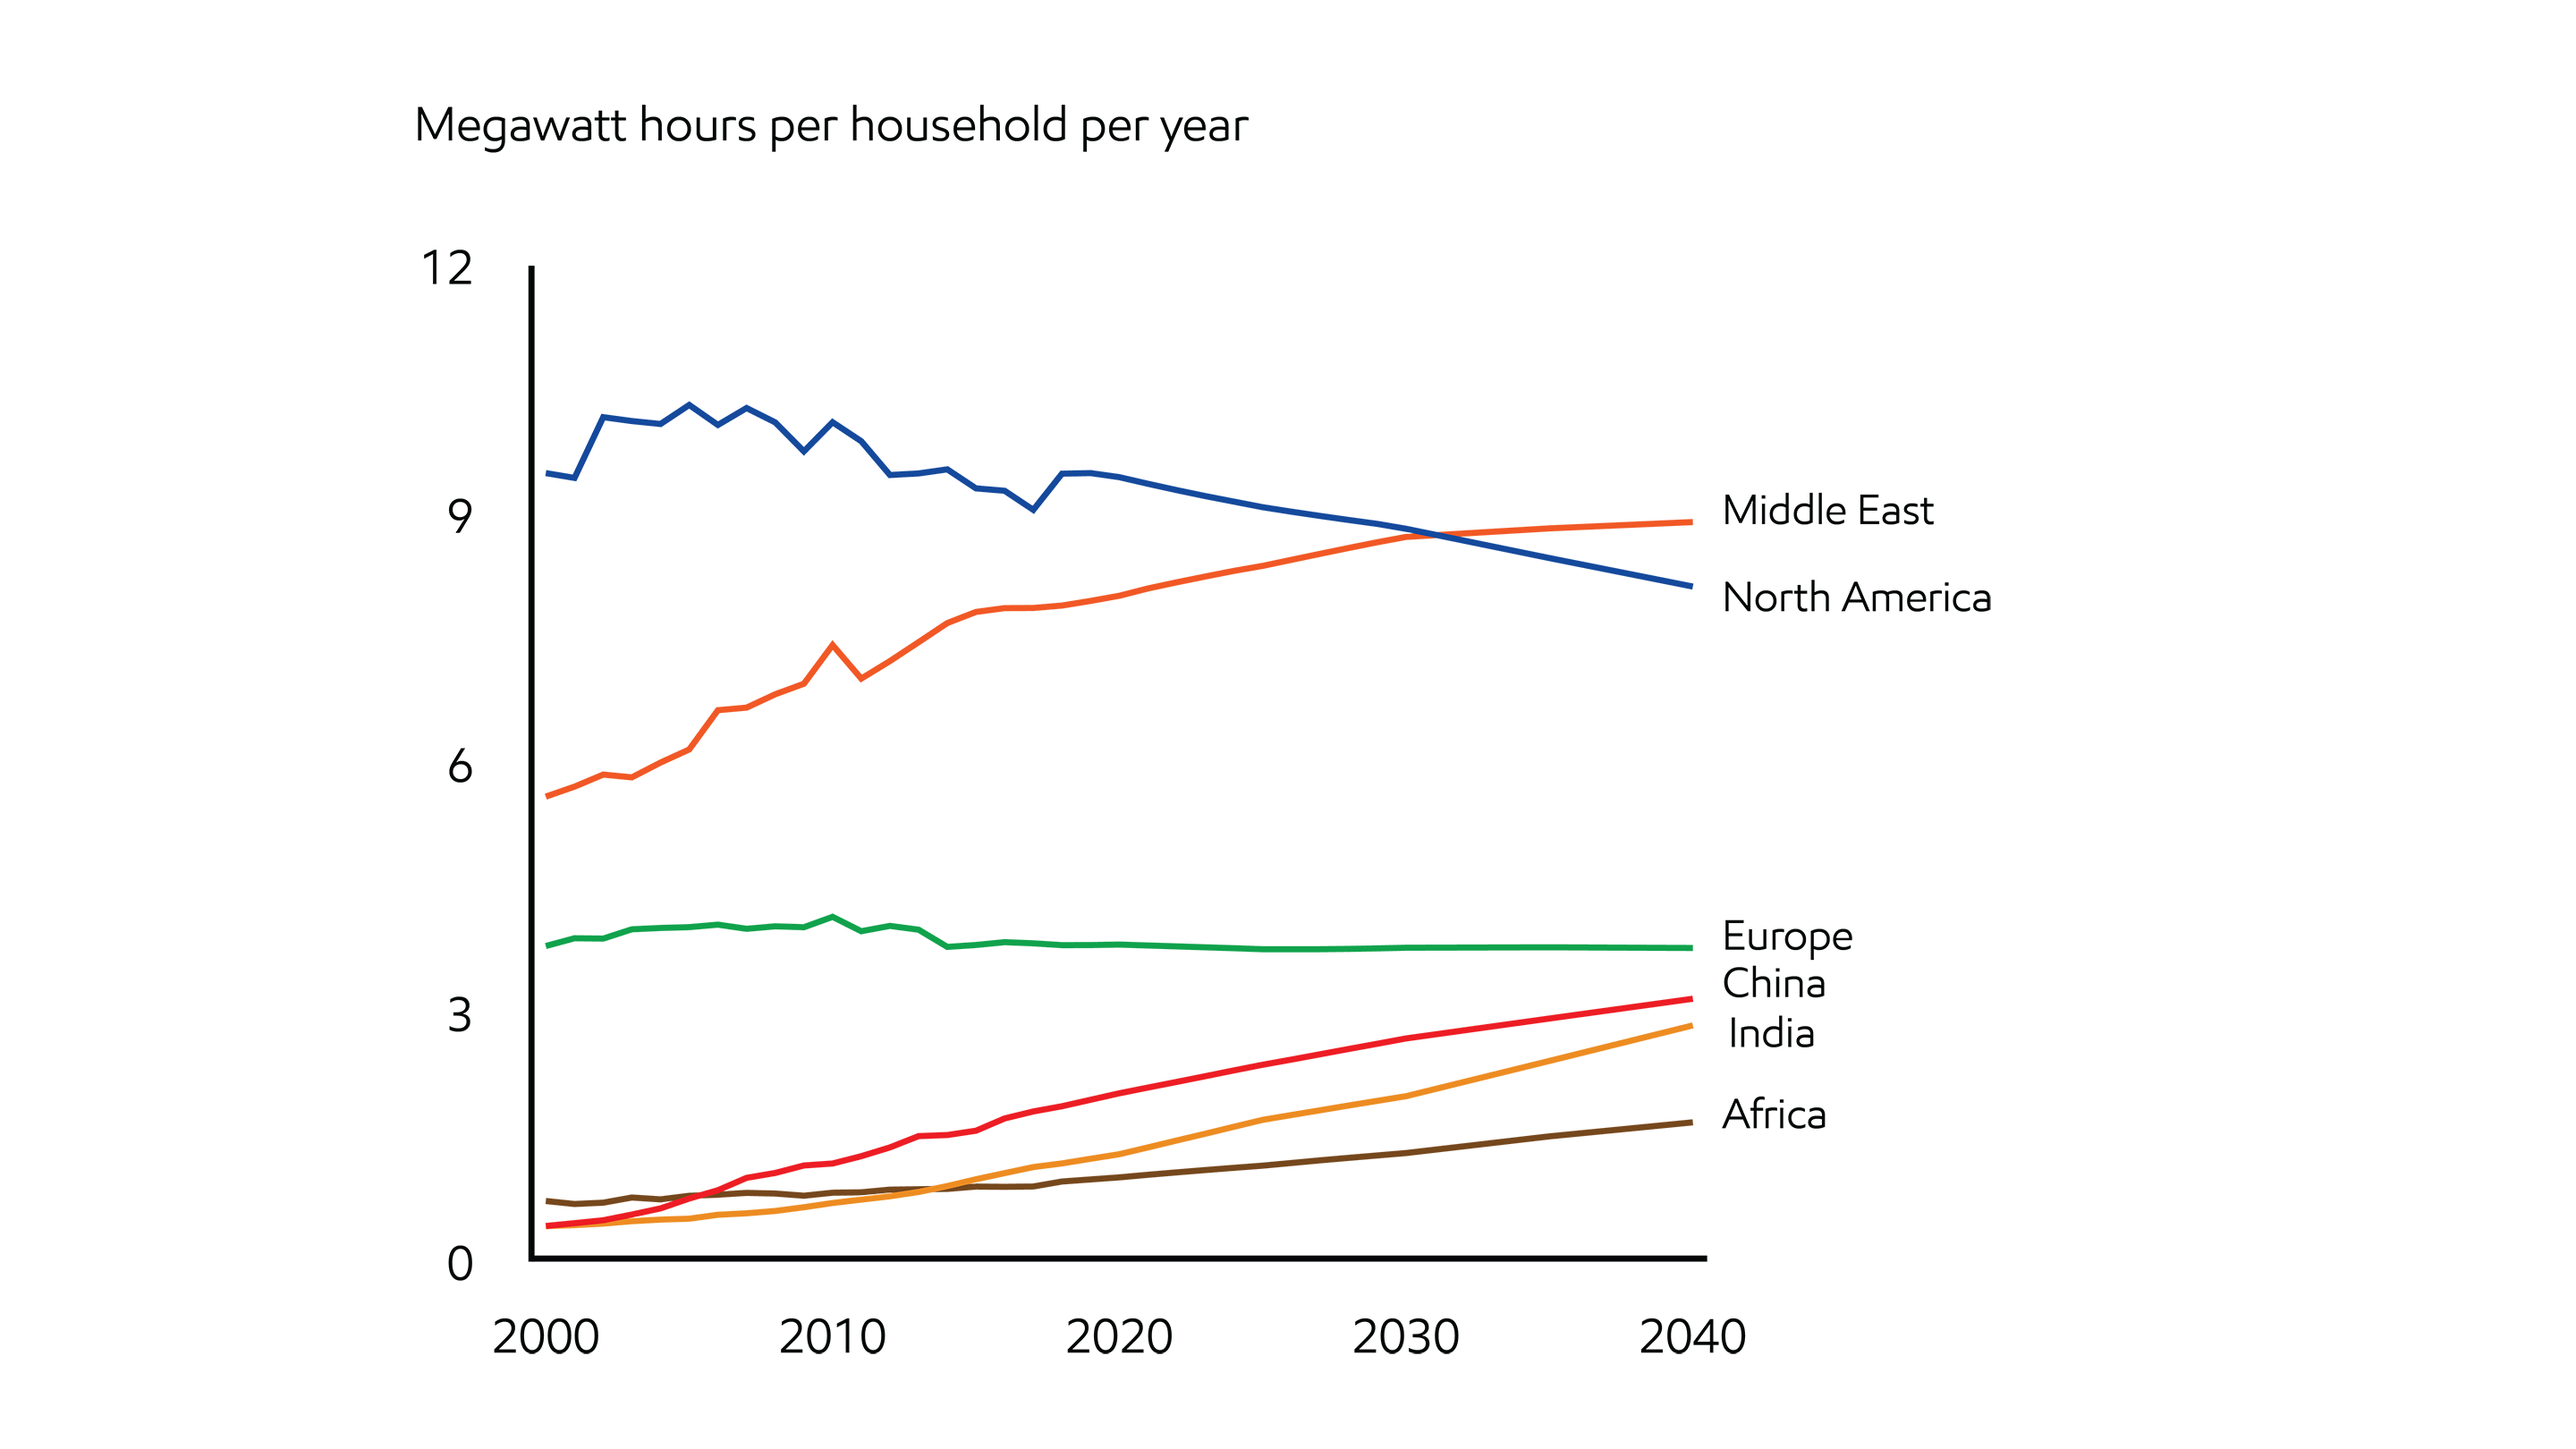
- Residential electricity use is expected to rise about two-thirds by 2040 as a substantially increased middle class seeks to improve health, security and comfort at home
- The annual electricity use per household in non-OECD countries rises about 60 percent with residential electricity use in India and China expected to grow strongly, bringing electricity consumption per household close to the European average by 2040
- Electricity use per household in OECD nations will be stagnant or declining as more efficient appliances help limit electricity requirements
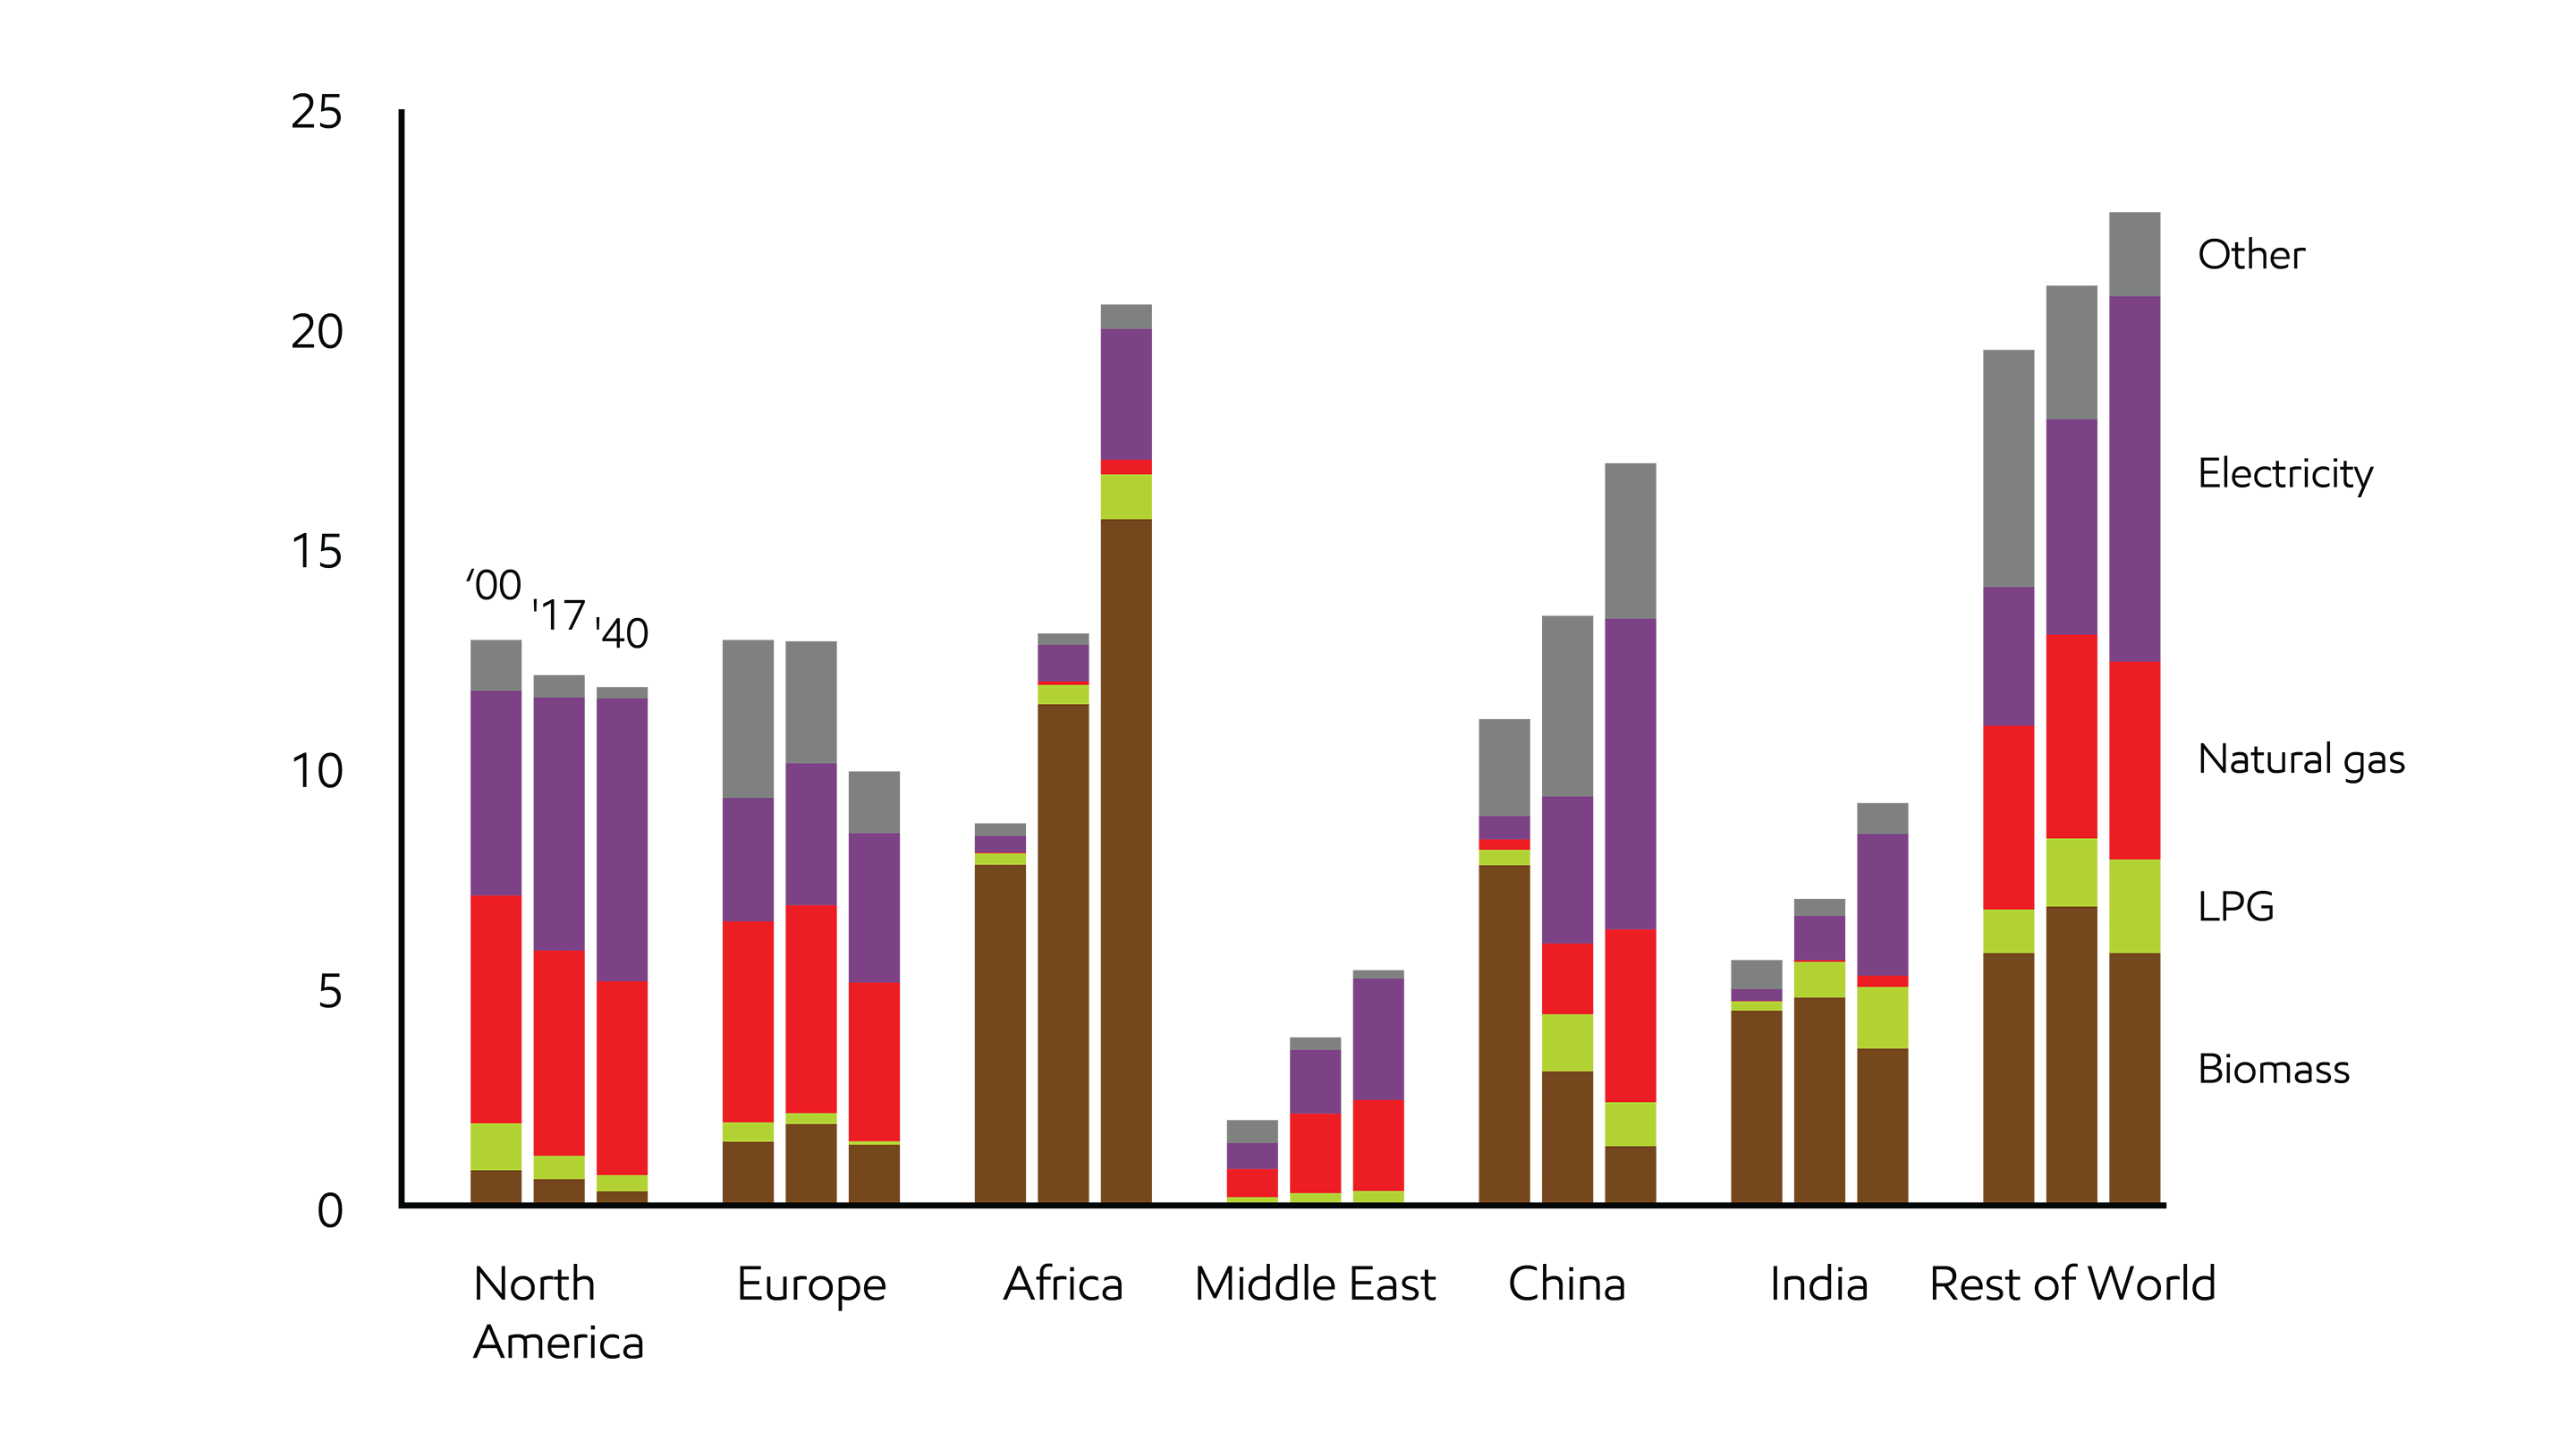
Residential energy fuel use varies across regions
Quadrillion BTUs
Industrial
Almost half of the world’s energy use is dedicated to industrial activity
As the global middle class continues to grow, demand for durable products, appliances and consumable goods will increase. Making these products and their components will take more industrial activity and more energy.
Industry grows in emerging markets, like India, Southeast Asia, the Middle East and Africa. Industry also evolves in developed nations as businesses and consumers strive to reduce their environmental impact by using energy more efficiently.
Industrial growth takes energy. It also takes innovation. This Outlook anticipates technology advances, as well as the increasing shift toward cleaner forms of energy such as electricity and natural gas. The industry of the future will do more with less energy and emissions than it does today.
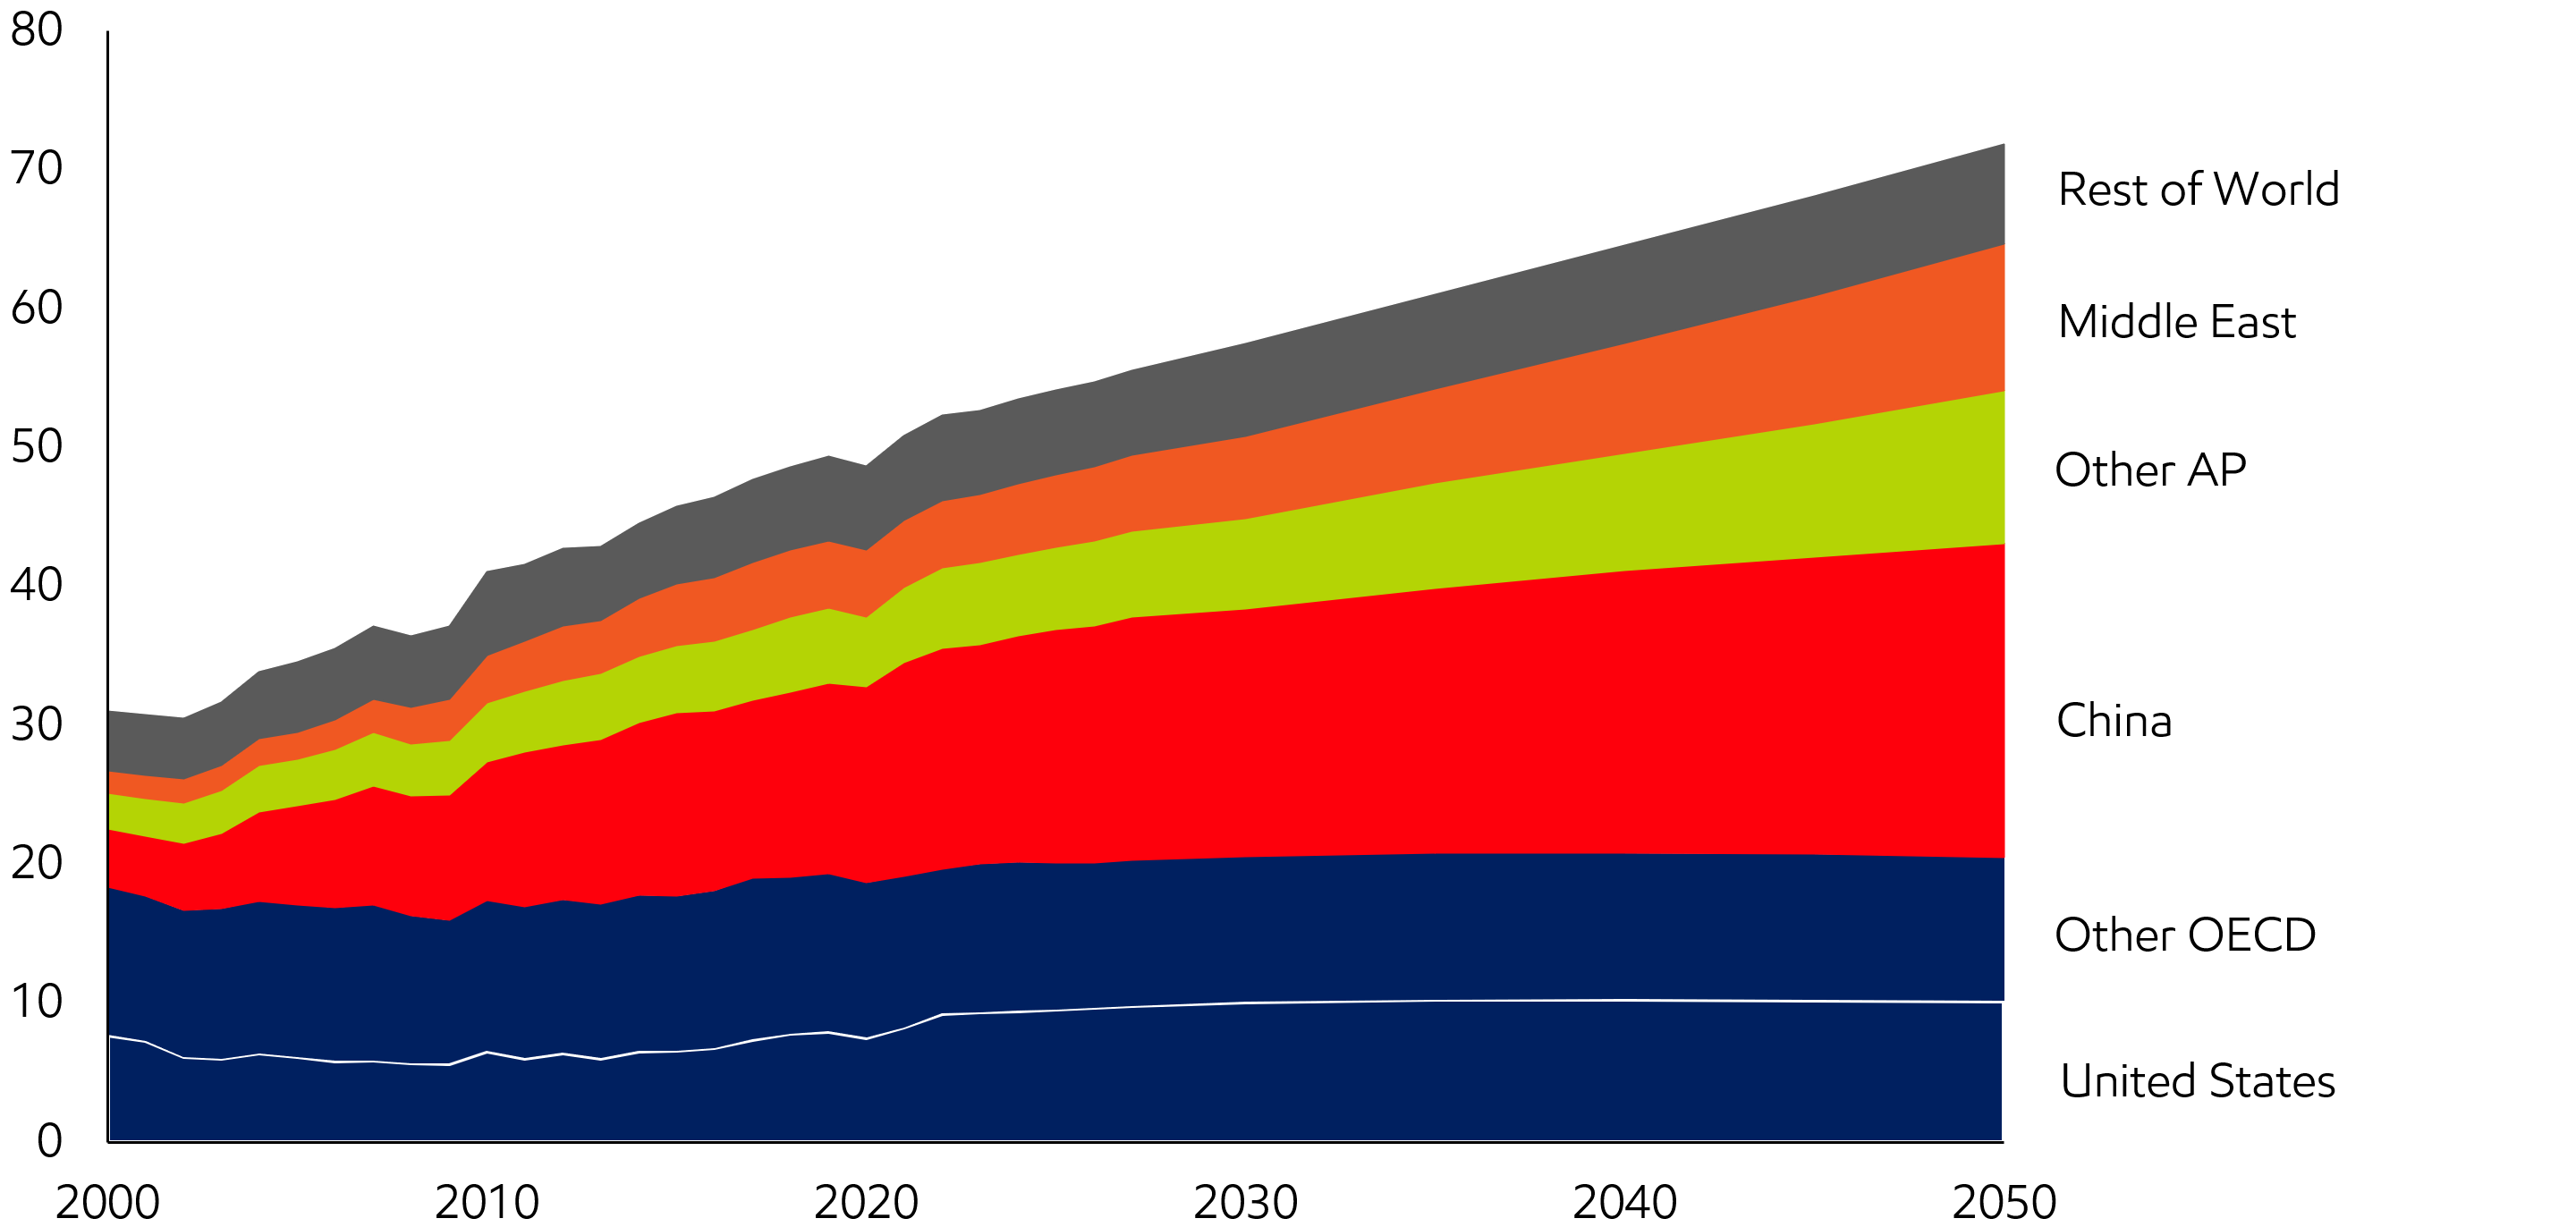
Industrial sector energy supports economic progress
Industrial sector energy supports economic progress
Global industrial energy demand – Quadrillion Btu

- The industrial sector provides about a billion jobs for people who work to feed, clothe, shelter and improve the lives of people around the world.
- Rising population and prosperity trigger demand for modern cities, medical equipment, mobility and home appliances that underpin the need for steel, cement and chemicals.
- In 2021, the industrial sector used about half the world’s electricity and nearly as much primary energy as the transportation and residential/commercial sectors combined.
- Increased options for consumers to ‘reduce, reuse, recycle’ and manufacturers’ efforts to improve industrial processes and efficiency can conserve fuel and mitigate emissions.
- Heavy industry (steel, cement, metals and manufacturing) and chemicals (plastics, fertilizer and other chemical products) are expected to account for nearly all of the growth to 2050.
Oil, gas and electricity fuel industrial growth
World – Quadrillion Btu

- Industry uses energy products both as a fuel and as a feedstock for chemicals, asphalt, lubricants, waxes and other specialty products.
- Shifting to lower-carbon fuels reduces the industrial sector’s 2050 direct emissions by around 25% versus 2021 even as primary energy demand increases by more than 10%.
- Oil, natural gas and electricity contribute almost all the energy needed to replace coal and meet the industrial energy growth to 2050.
- Oil grows because it is particularly well suited as a feedstock; companies choose natural gas and electricity for their versatility, convenience and lower direct emissions.
- Coal use declines as nations and businesses strive to reduce their environmental impact; it is expected to keep playing a role in steel and cement manufacturing.
Heavy industry energy intensity improves
Industrial sector energy intensity – Thousand Btu per dollar of GDP (2015$)
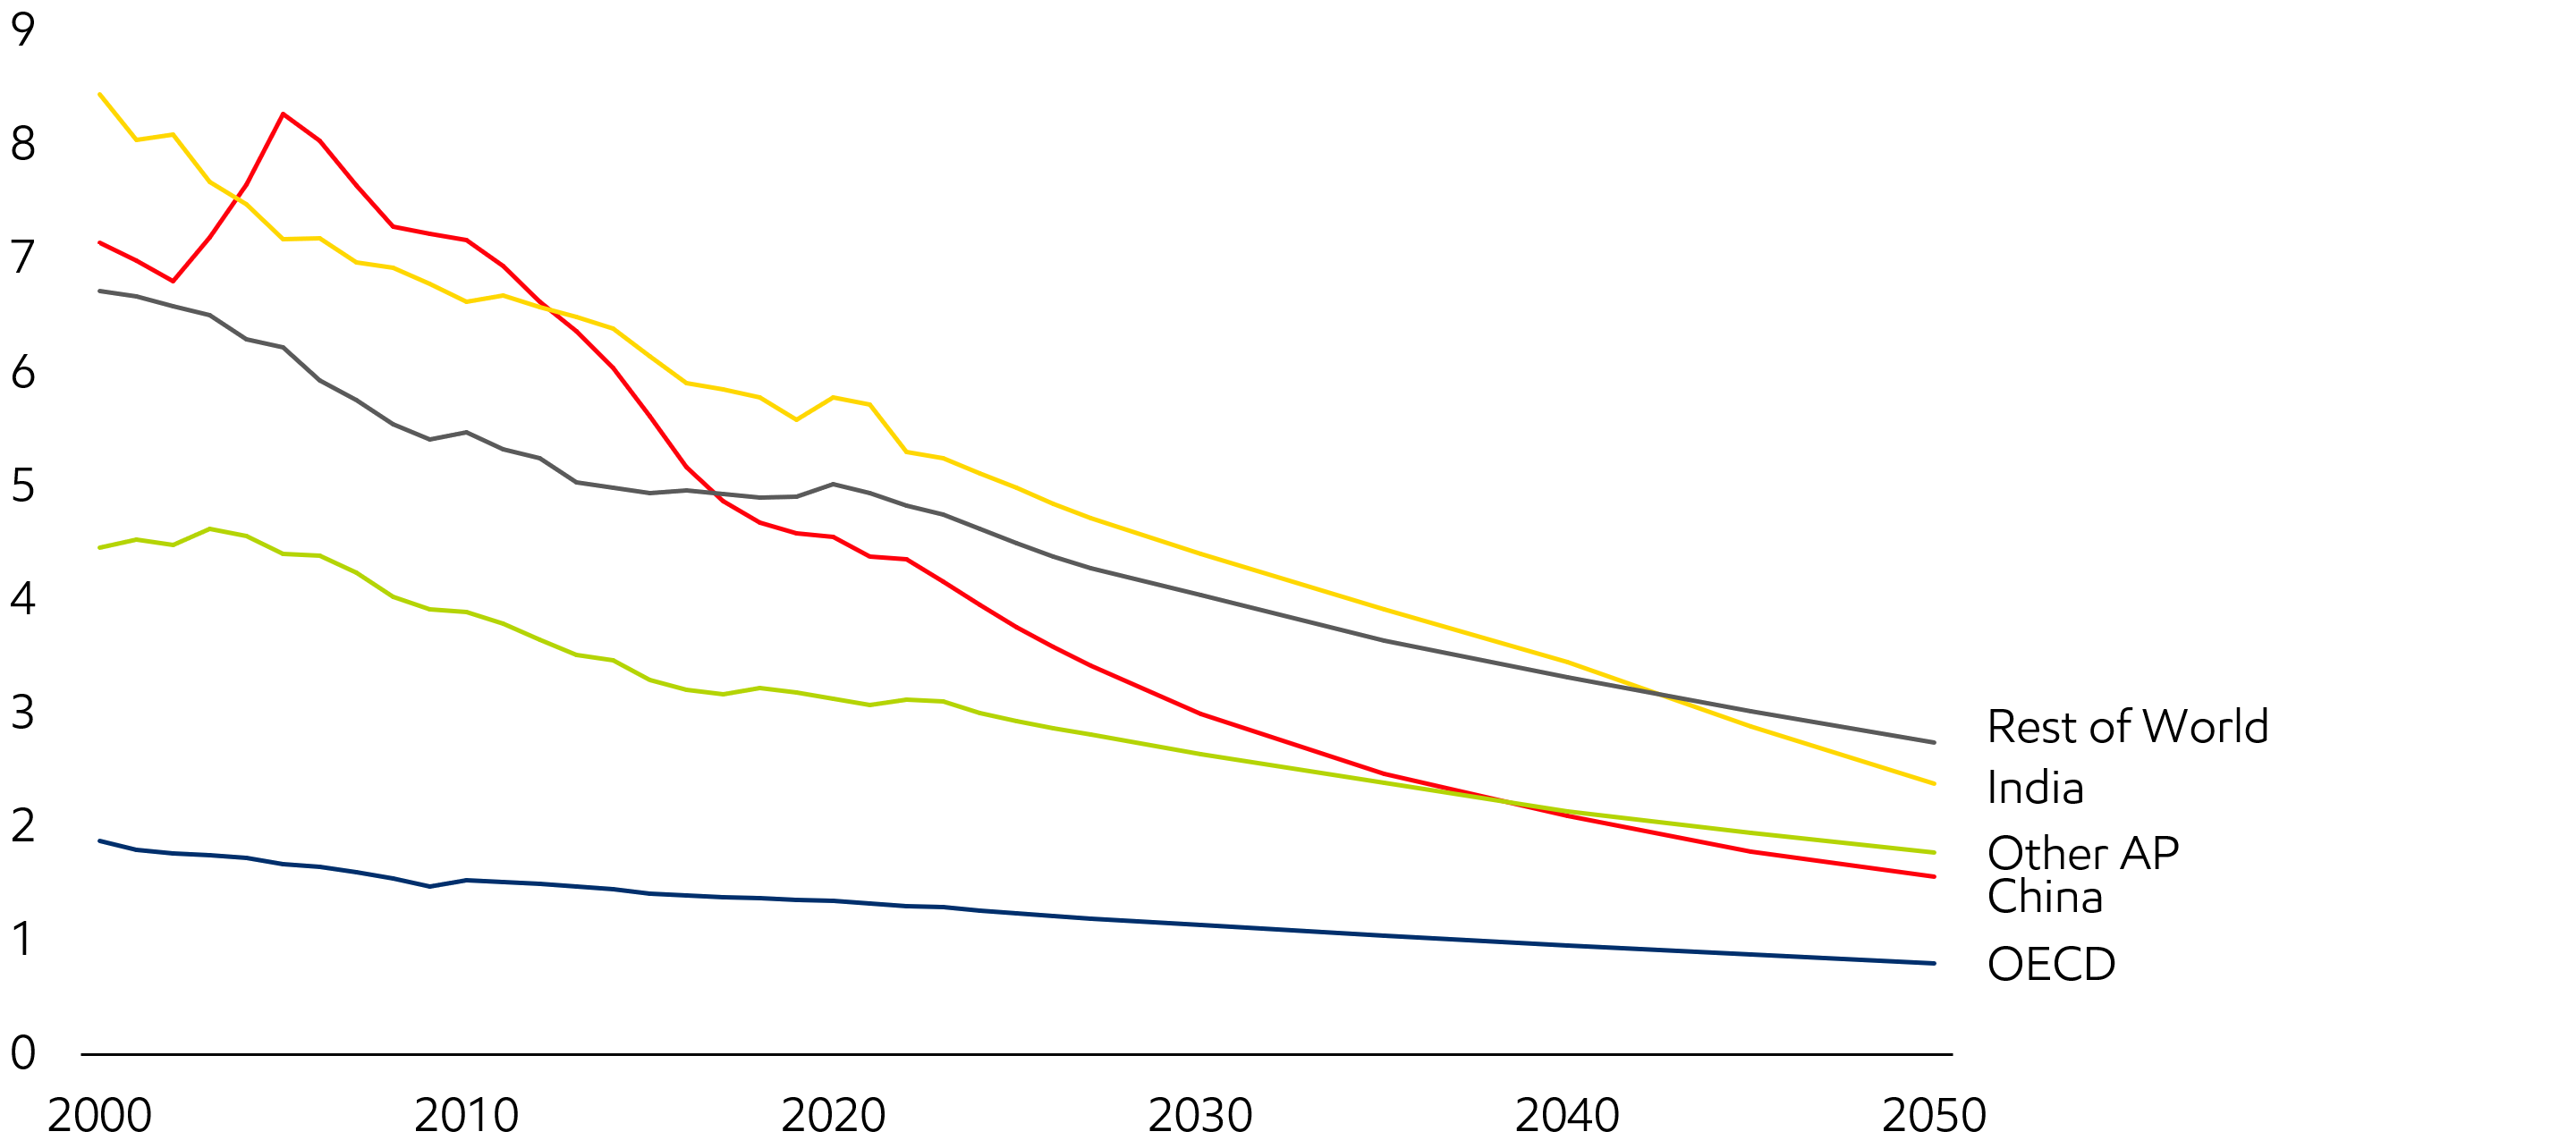
- Heavy industry energy intensity measures the amount of energy used in heavy industry and manufacturing per dollar of overall economic activity (GDP).
- Producing more value with less energy has a positive impact – economically and environmentally – for manufacturing companies and countries.
- Developed nations have lower energy intensity due to their service-based economies and predominance of higher-value, energy-efficient industries.
- China's energy intensity, which spiked as it invested in infrastructure and heavy industry, has been improving rapidly as its economy matures and efficiency increases.
- Optimizing energy use via advances in technology, processes and logistics can help companies remain competitive and contribute to gains in global energy intensity.
Heavy industry transitions toward cleaner fuels
2021 - 2050 growth – Quadrillion Btu

- Manufacturing tends to gravitate toward regions with access to abundant, affordable energy, an able workforce and balanced policies
- Each region’s fuel mix differs based upon its unique blend of manufacturing activity and the relative availability and cost of its energy sources
- Electricity use is expected to grow; it is ideal for motors, robotics and process controls
- Natural gas is expected to give a competitive edge to resource-rich areas of Africa, the Middle East and Latin America; it also helps China manage its air quality
- Coal’s use declines in the OECD and China but doubles in coal-producing India and the rest of Asia because of coal’s abundance and affordability relative to other fuels
Chemical projections
Consumer demand boosts need for chemicals
Feed and energy growth – Quadrillion Btu
- Chemicals are the building blocks for thousands of products that people rely on every day. Demand for fertilizer, cosmetics, textiles and plastics grows through 2050 as rising living standards enable people to buy more medical devices, food, cars, computers and home goods.
- Asia Pacific’s chemicals production grows to meet the needs of its rising middle class.
- Producers in the United States and Middle East chemicals production tap abundant, affordable energy supplies (used as feedstock and fuel) to gain competitive advantage.
- Europe, Russia, South Korea and Japan remain important contributors to global chemicals production.
Chemicals production relies on oil and natural gas
World – Quadrillion Btu
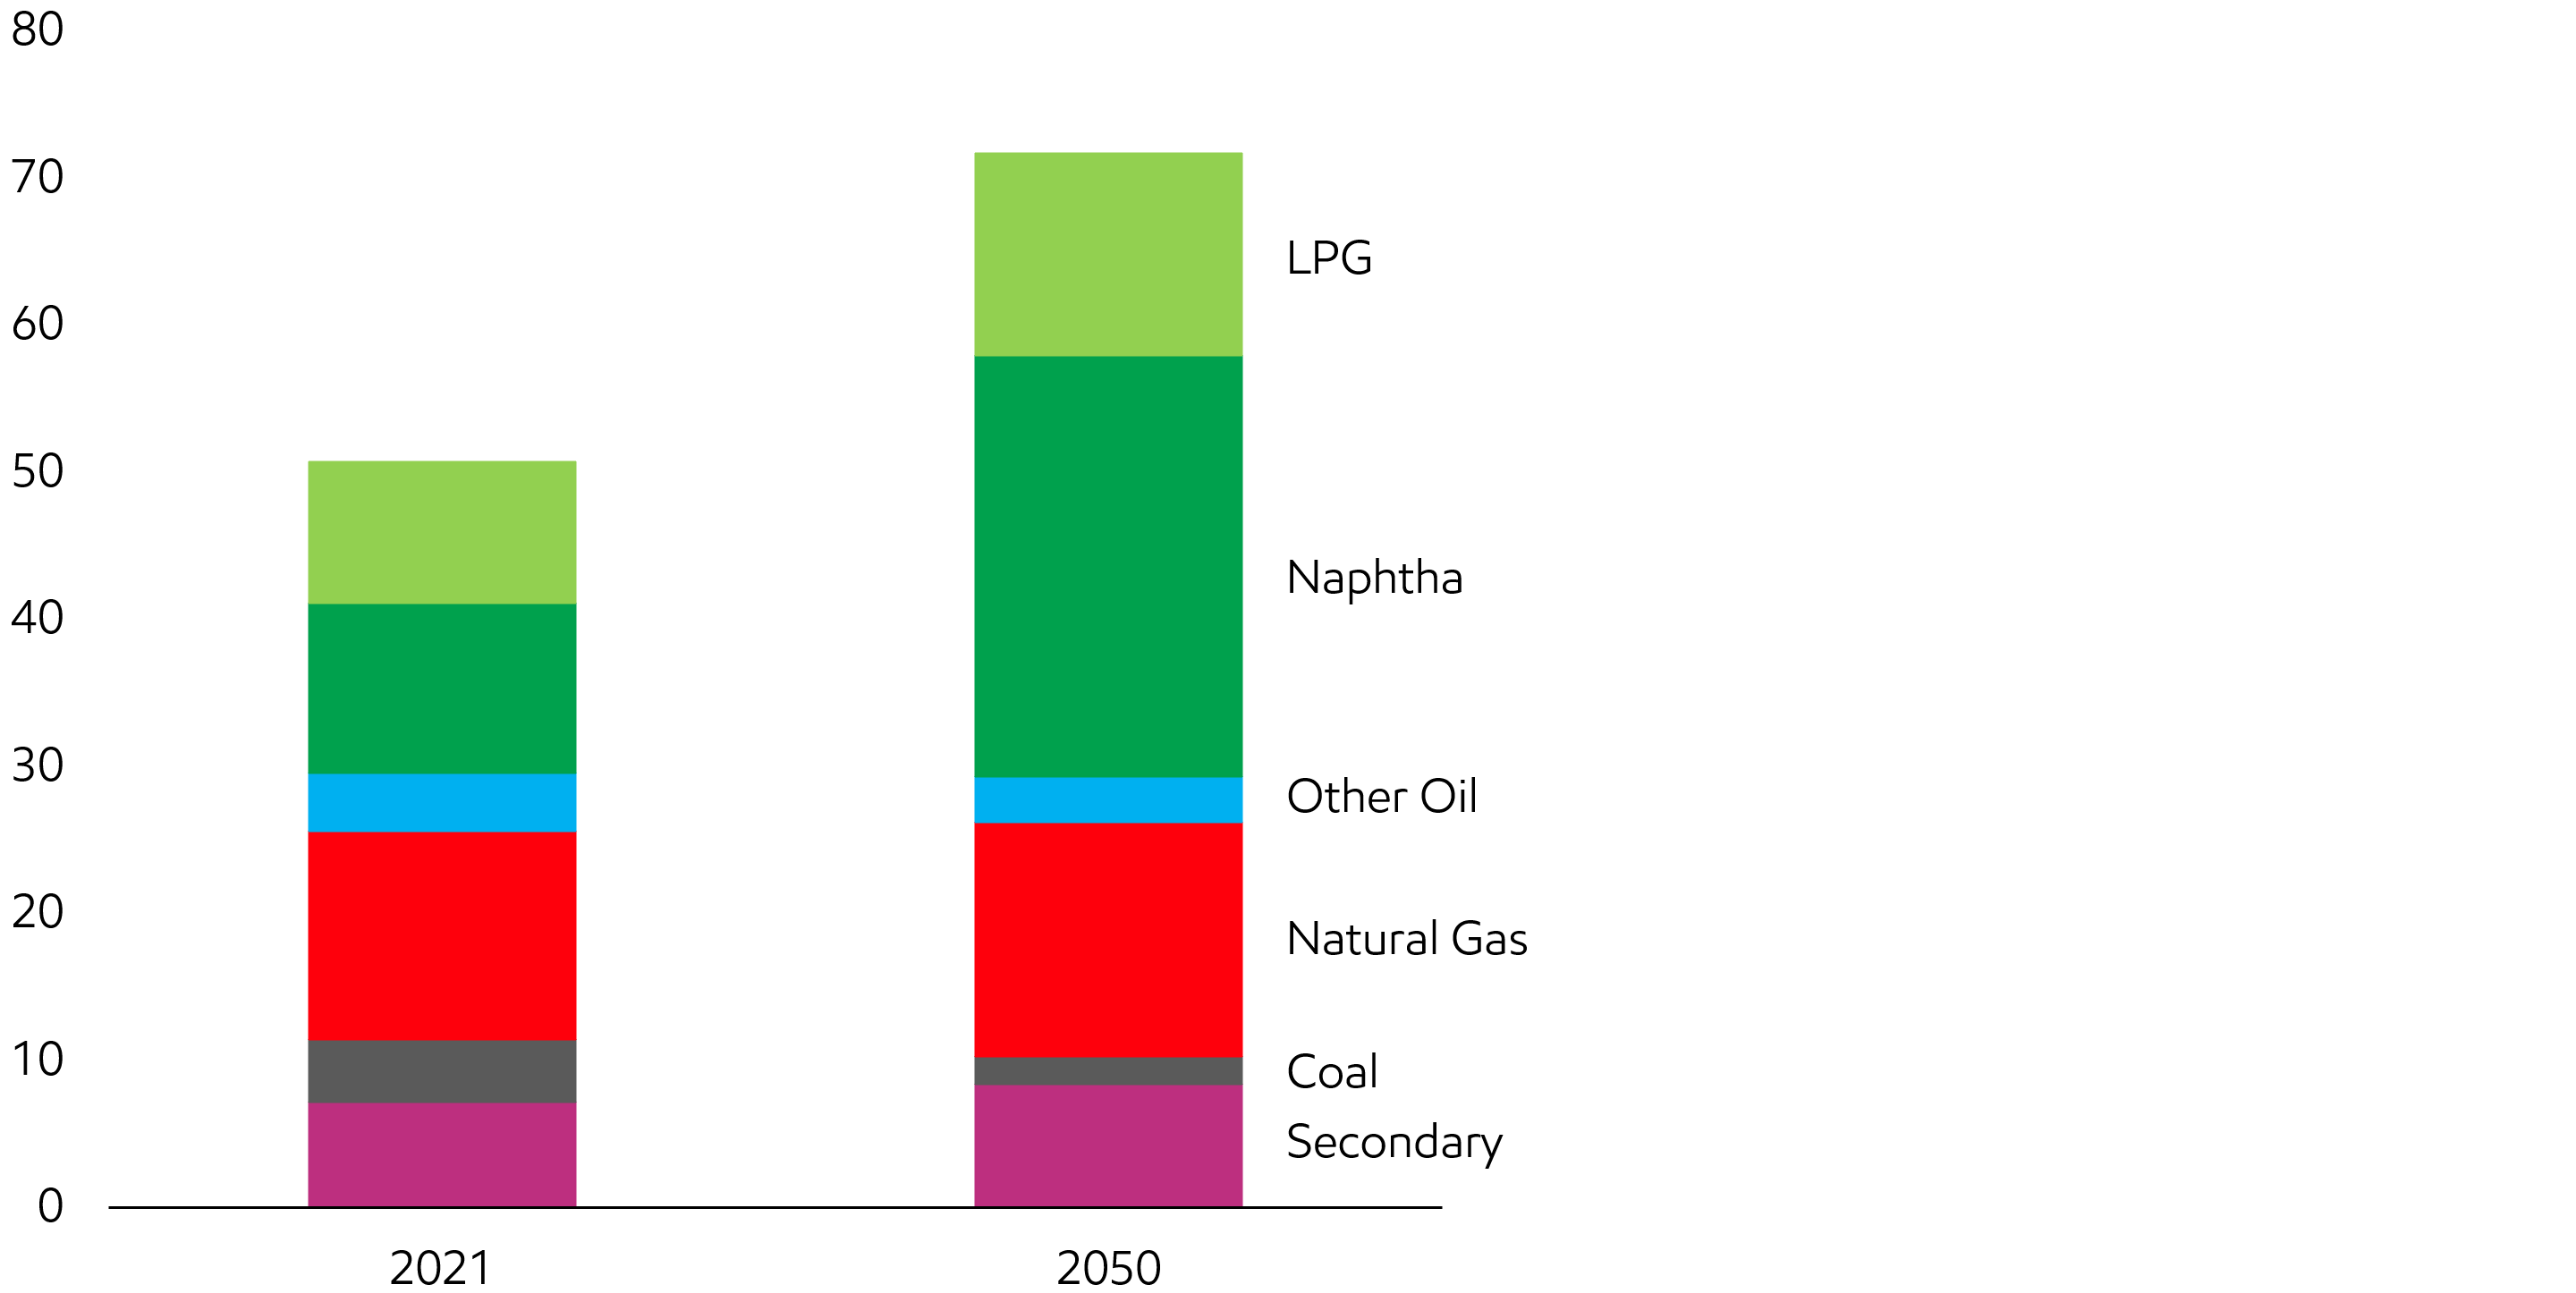
- The chemical industry uses hydrocarbon products as both a feedstock and a fuel.
- Naphtha and natural gas liquids are primarily used as feedstock; natural gas is used as both a feedstock (notably for fertilizer) and a fuel.
- Natural gas liquids use grows by around 40% from 2021 to 2050, as unconventional oil and natural gas production in the U.S. expands supply.
- Naphtha is expected to remain the dominant feedstock in Asia; the Middle East is expected to rely on natural gas liquids and natural gas.
- Advances in plastic materials and chemical processes can save energy as the industry continues to meet rising consumer demand for high-performing products.
Electricity and power generation
Global electricity demand rises more than 80%
Electricity demand is expected to grow around the globe, supplied primarily by growth in wind, solar, natural gas-fired generation, and nuclear. Besides meeting residential, commercial, and industrial demand, the increase in electricity demand is also fueled by the growth of electric vehicles in light-duty transportation. Cost reductions in transportation batteries are being leveraged for other applications including larger-scale electricity storage.
Today, batteries represent a small share of installed capacity on the grid, and they are primarily used for short-duration storage. The increased production from weather-dependent wind and solar triggers more transmission build-out, more storage and more natural gas plants that provide rapid backup to address short-duration demand peaks. To maintain reliable and affordable electricity, the world will need new solutions deployable at commercial scale.
Electricity generation highlights regional diversity
Net delivered electricity – Thousands of terawatt-hours

- The mix of electricity generation varies geographically based on factors including technology costs, domestic resource availability and policy targets (for example, renewable portfolio standards for local generation).
- Much of the world continues to shift further toward lower-emission sources for electricity generation, led by wind and solar, natural gas and nuclear, based on local opportunities and policies.
- In 2021, coal-fired generation was the leading source of electricity (accounting for about 45% in developing countries). China’s coal-fired electricity is forecast to fall by more than a third through 2050, replaced primarily by a combination of wind, nuclear, natural gas, and solar.
- The share of electricity use in transportation is expected to grow from today’s low levels with increasing penetration of electric vehicles as a result of cheaper batteries and emissions/fuel economy targets.
Renewables and natural gas dominate growth
Global growth 2021-2050 – thousand TWh (net delivered)

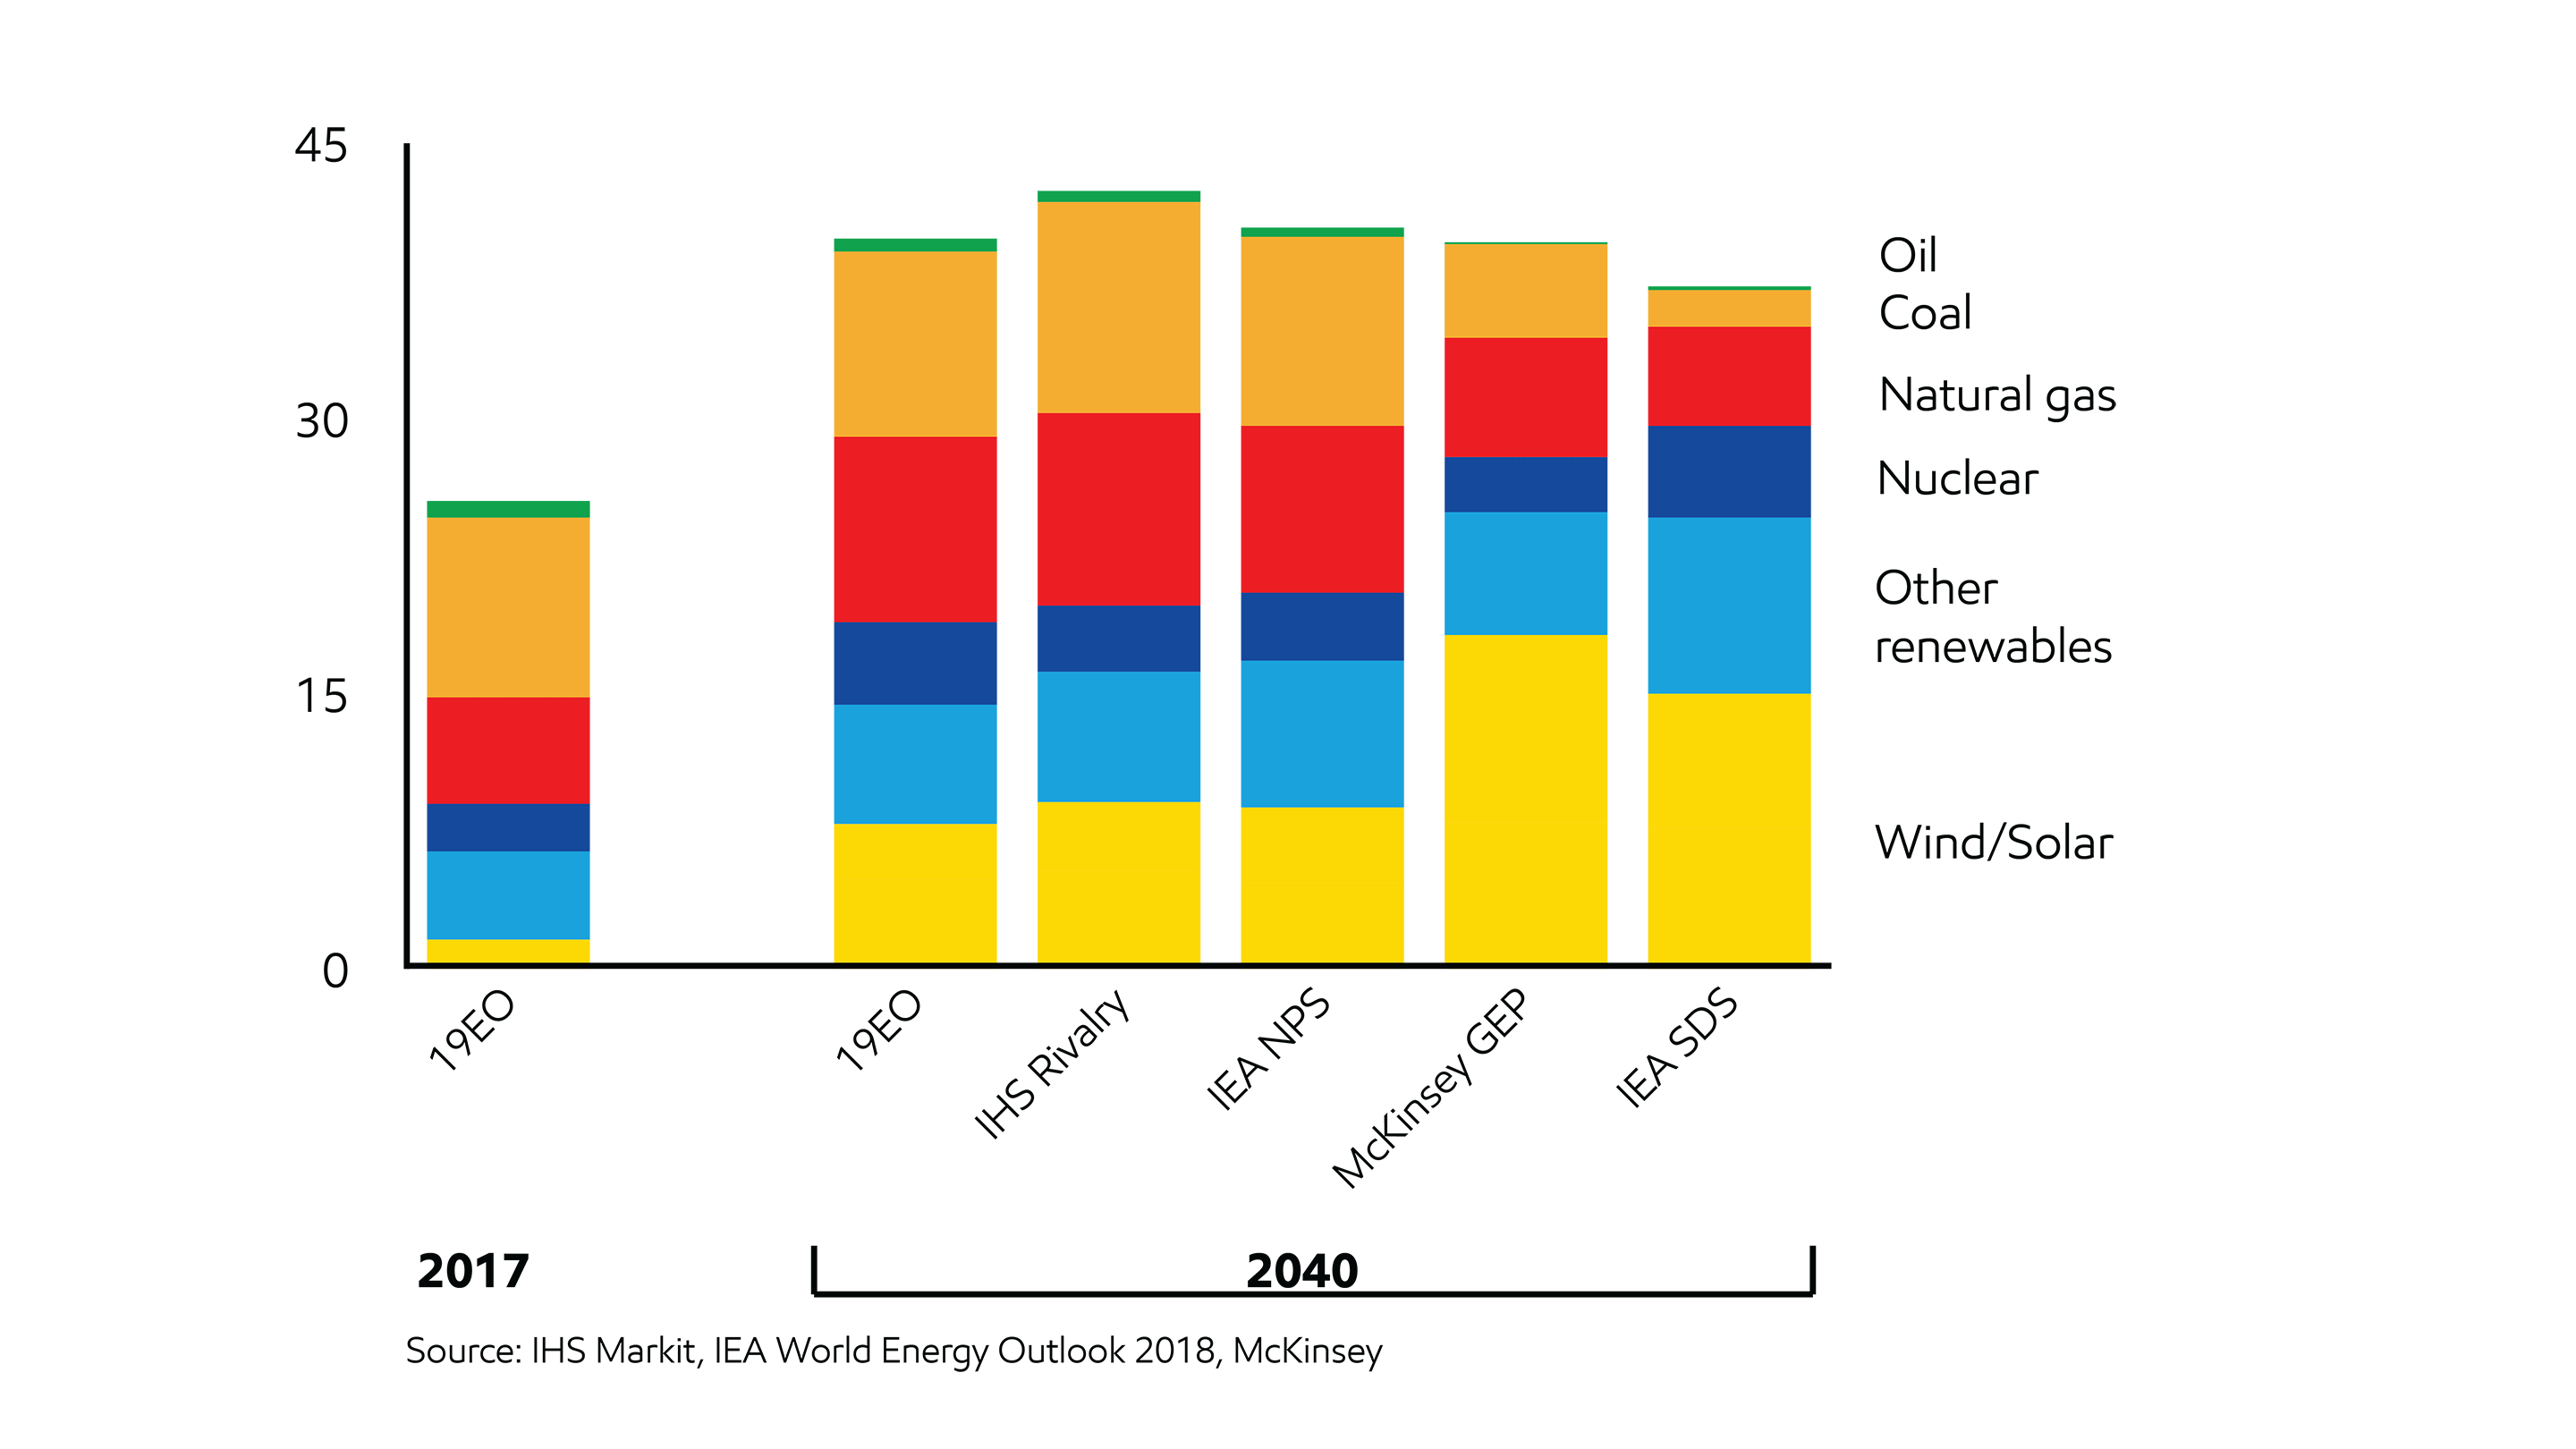
- Wind and solar generation grow the most to 2050, supported by technology cost reductions (particularly for solar) and policies targeting lower CO2 emissions.
- Natural gas grows both in and out of developed countries, where growth comes from coal-to-gas switching. 40% of the natural gas growth among developing nations occurs in gas-producing Middle East and Africa.
- Most new nuclear generation is built in China. Demand is projected to decline in developed countries as some phase out nuclear generation.
- Coal-fired generation drops from 45% to 20% share by 2050 in developing countries, and from 20% to 1% in developed nations as the world aims to reduce its emissions.
- Wind and solar grow across the globe, but penetration in 2050 varies based on natural resource quality and levels of policy support. Globally, wind and solar’s share of delivered electricity grows, from 10% in 2021 to 40% in 2050.
- In 2050, wind and solar are expected to deliver around 50% of electricity in Europe and North America, contributing to renewables policy goals.
- Renewables growth in Asia Pacific contributes to local air quality improvements and energy security goals.
- High penetration levels can incur additional costs to manage intermittency through flexible backup generation, transmission buildout and storage to ensure reliable electricity delivery.
Renewables penetration increases across all regions
Wind/Solar share of delivered electricity – % share of TWh

Views of the electricity supply mix vary based on assumptions
Supply of electricity - Thousand TWh
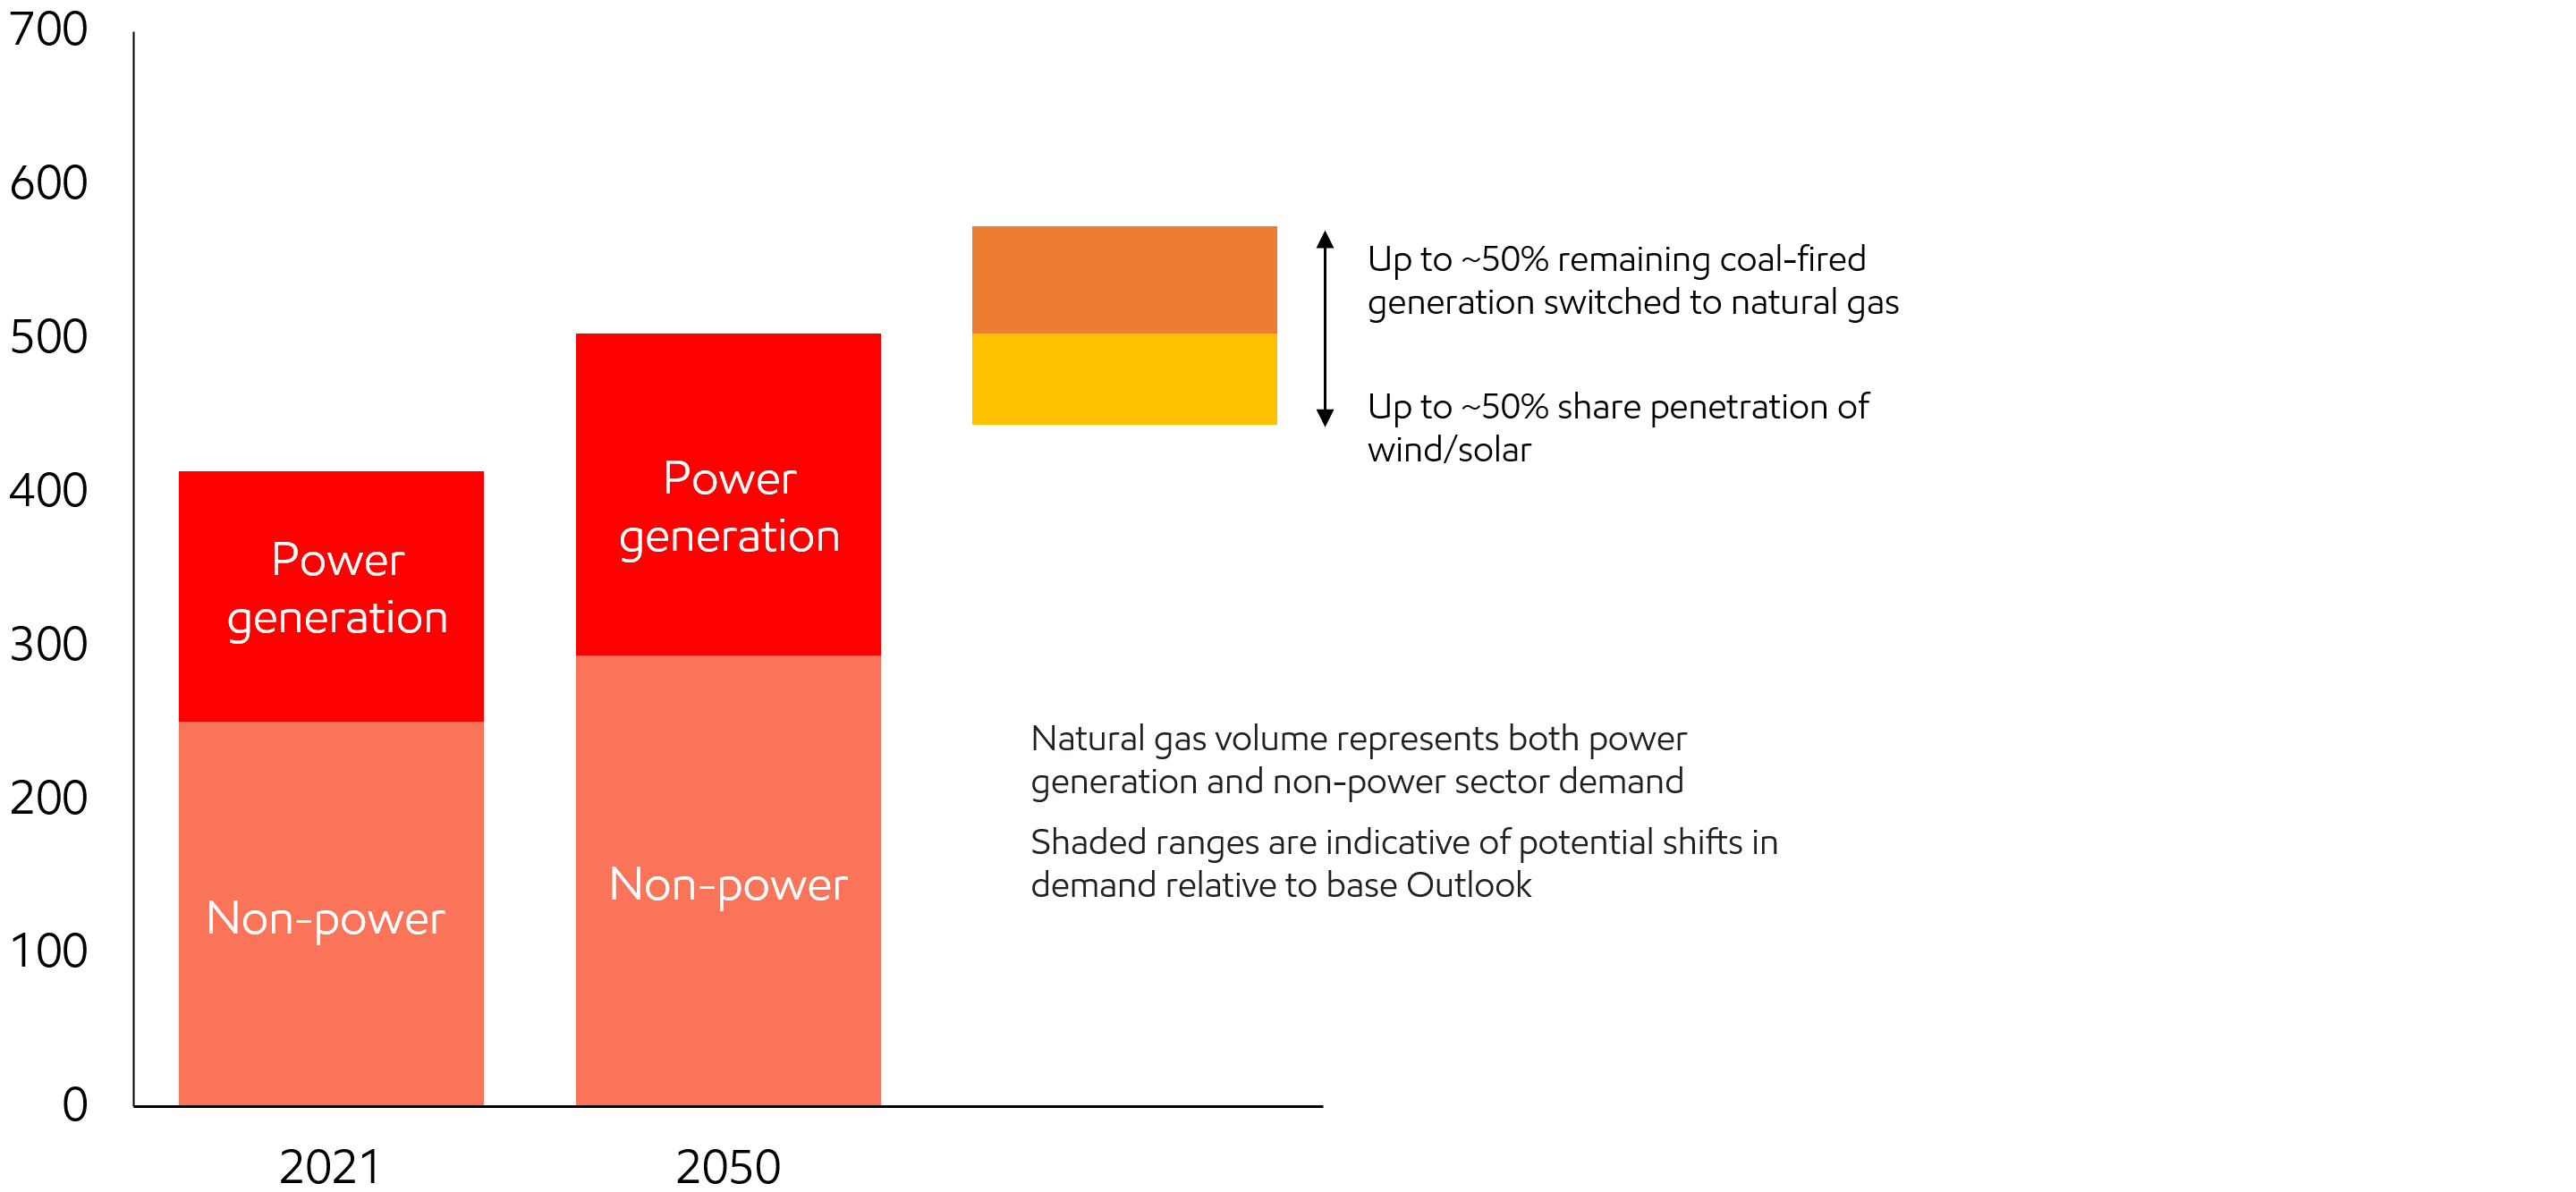
Different policy or technology choices can impact gas demand
Global natural gas demand sensitivity – billion cubic feet per day
Related content
How we develop our Outlook
ExxonMobil uses a data-driven approach to understand potential future energy demand and supply.
Report
•

Energy supply
Energy – in all its forms – enables growth and prosperity. As economies grow, as technology advances, as consumers become more environmentally aware, and as policies adapt, global energy demand will evolve to meet changing needs.
Report
•

Emissions
Providing reliable, affordable energy to support prosperity and enhance living standards is coupled with the need to do so in ways that reduce impacts on the environment, including the risks of climate change. This is society’s dual challenge and ExxonMobil takes it seriously.
Report
•

Pursuing a 2°C pathway
Many uncertainties exist concerning the future of energy demand and supply, including potential actions that societies may take to address the risks of climate change.
Report
•

Outlook for Energy: A perspective to 2040
The 2019 Outlook for Energy is ExxonMobil’s latest view of energy demand and supply through 2040. For many years the Outlook has helped inform ExxonMobil’s long-term business strategies, investment plans and research programs.
Report
•

Global fundamentals
Energy is essential for society’s progress. Economic expansion and improving access to energy enable longer, more productive lives for the growing global population.
Report
•